Skeleton screen vs spinner vs progress bar, chosen by wait time
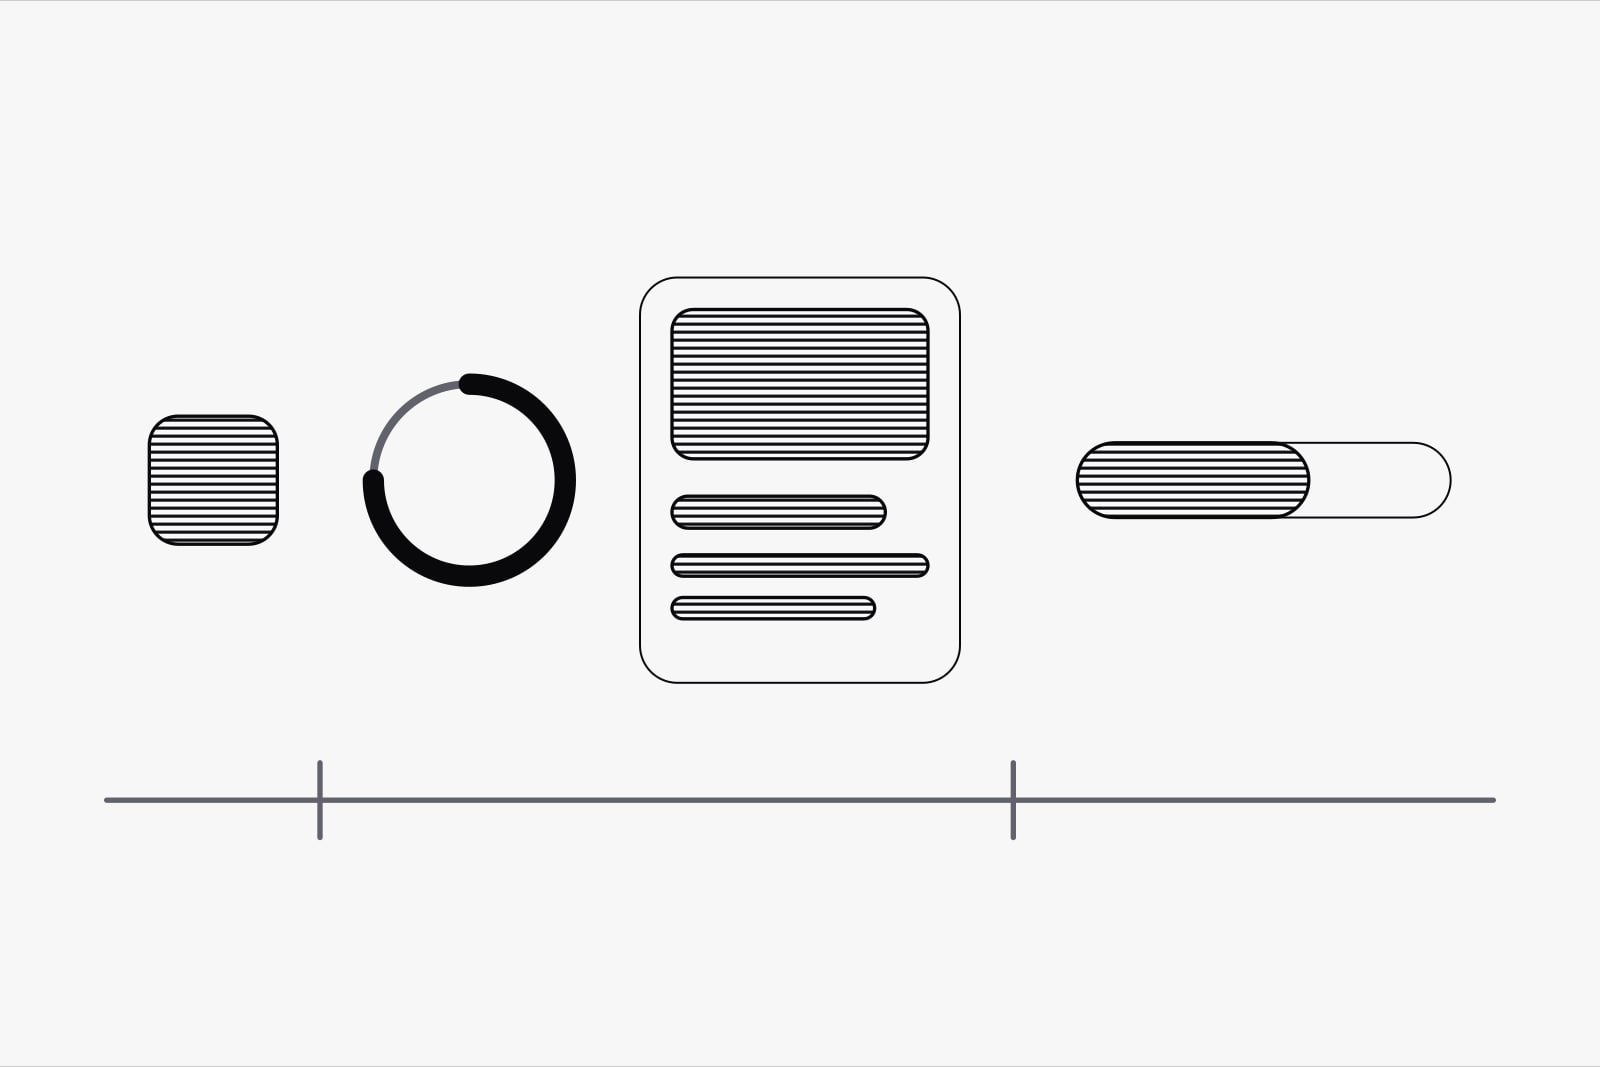
A loading indicator is the part of an interface that tells someone the product is still working while they wait, and the right one depends mostly on how long that wait lasts. Under a second, show nothing. Between two and ten seconds, a spinner for one part of the screen or a skeleton screen for a whole page. Past ten seconds, a progress bar that says how much is left. Skeleton screen vs spinner is a question about time first and taste last.
It matters to anyone shipping a dashboard, a search, a report or an AI feature, because those are the screens where a request takes long enough to be felt. Pick the wrong indicator and a fast screen looks jumpy, or a slow one looks stuck.
The short version
Measure how long each request takes for real users, then pick by the slow end of that range:
- Under 1 second: no indicator. Show the result.
- 1 to 2 seconds: a small, local cue (a button that turns busy, a list that fades), held back so it never flashes.
- 2 to 10 seconds, one module: a spinner inside that card, table or chart.
- 2 to 10 seconds, a full page: a skeleton screen that matches the final layout.
- Over 10 seconds: a percent-done bar, an estimate of the time left and a way to cancel.
How long is the wait? The three limits that still hold
Jakob Nielsen set out three response-time limits in 1993, from research going back to the 1960s, and Nielsen Norman Group still uses them. At 0.1 seconds a reaction feels instant, as if the user caused it directly. At 1 second the delay is noticed, but the user's flow of thought holds. At 10 seconds attention breaks: people start doing something else, and they need a moment to find their place when they come back.
Every rule in this article sits on those three numbers. They also explain why an indicator under one second does harm. NN/g's guidance is that a looped animation shorter than a second distracts, because it flashes faster than people can follow and leaves them wondering what just happened.
Where a skeleton screen wins
A skeleton screen is a grey wireframe of the page that stands in for the content until it arrives: bars where the text will be, boxes where the pictures will be. NN/g's guidance limits it to full-page loads that take under 10 seconds. Inside that window it does two things a spinner can't. It shows the page's structure before the content lands, so the reader builds a picture of where things will be. And it turns the load into a gradual change from wireframe to page, where a blank screen would fill all at once.
Three conditions decide whether it works:
- The layout is predictable. A feed, a profile, a product page, a dashboard with fixed cards. If the server can return two items or two hundred, the skeleton guesses wrong and the page jumps when the real content lands.
- The skeleton is the real layout. Same heights, same columns, same gaps. Every placeholder that changes size on arrival is a layout shift, and Google counts those: a Cumulative Layout Shift of 0.1 or less is the threshold for a good score.
- The interface is familiar. A returning user recognises the shape of the page and reads the skeleton as almost there. A first-time visitor sees grey boxes that mean nothing yet.
NN/g also names one variant to avoid: the frame-only skeleton, a header and a footer around an empty middle. It carries no information about the page, so it works like a spinner, and on a long wait it looks like a page that has stopped working.
Where a spinner wins
A spinner is a looped animation that says the system is working and nothing more. It gives no hint of how long. That makes it the right tool for one part of the screen, and for waits of two to ten seconds, the range NN/g recommends for looped animations.
- One module on a page that's already there. A chart refreshing after a filter change, a card fetching its numbers, a table loading its next page. The spinner sits inside the module and leaves everything else usable.
- An action. Save, send, pay, export. A skeleton makes no sense when nothing new is being laid out, so the button itself turns busy and keeps its width, and the row around it doesn't move.
- A shape nobody can predict. Search results that may come back empty, a page whose sections depend on permissions. Drawing a skeleton there is a promise the content may break.
The limit is ten seconds. A spinner that keeps turning past that point gives no sign of whether the system is still working or has stopped, and people start to leave.
When only a progress bar will do
Past ten seconds, attention is gone, and the user has to decide whether to wait or come back later. A percent-done indicator gives them what that decision needs. Nielsen's rule from 1993 still applies: anything slower than ten seconds needs a percent-done indicator and a clearly signposted way to interrupt it.
That covers uploads, imports, exports, video processing, bulk edits and long AI jobs. Three details keep the bar honest:
- It never moves backwards. NN/g defines a percent-done bar as one that fills from 0 to 100 percent and never decreases.
- It counts real work. Files uploaded, rows imported, pages rendered. When the total is unknown, show the work done so far ("1,240 rows imported") rather than an invented percentage.
- It says what is happening. "Importing contacts, about 2 minutes left" lets the person switch tabs and come back.
For a job that runs for minutes, the best indicator is none at all: run it in the background and tell the user when it's done.
What the research says about perceived wait
An indicator changes how long a wait feels. The wait itself stays the same length. Two findings pull in different directions, and both are useful.
In a study at the University of Nebraska-Lincoln, cited by NN/g, people who saw a looping progress bar while a page loaded were more satisfied and willing to wait on average three times longer than people who saw no indicator.
Skeleton screens have a weaker record. Viget tested 136 people on three loads of identical length: a skeleton screen, a spinner and a blank screen. The skeleton group guessed the longest wait, 2.82 seconds on average, against 2.41 for the spinner and 2.29 for the blank screen. The authors concluded that skeleton screens don't fix perceived performance on their own, and that they do better in interfaces people already know.
The two results fit together. On a short load, an empty screen can feel as quick as any indicator. On a longer one, a moving indicator keeps people who would have given up on a blank page. Between a spinner and a skeleton, the skeleton earns its place only when it shows the user something true about the page they're about to see.
What we use and why
On the products we design and build, the indicator is picked per request, from data. Five rules:
- Pick from the slow end. We size each request at the 75th percentile of real loads, the same percentile Google uses for Core Web Vitals. A request that averages 800 ms and reaches 4 seconds on a slow phone needs an indicator, even though the average says it doesn't.
- Hold the indicator back. Nothing appears for the first few hundred milliseconds. Fast responses then show no indicator at all, and nothing flashes.
- Plan for the tail. NN/g's example is data that should take 2 seconds and takes 15 in bad conditions. So every spinner and skeleton has a second state: after about ten seconds it adds a line saying what is still loading, and a way out.
- Build the skeleton from the real components. The placeholder uses the same grid and the same heights as the content it replaces, so the swap shifts nothing.
- Keep the page usable. A slow chart gets a spinner inside its own card, and the filters, the navigation and the other cards stay live.
The fastest indicator is the one you never need. Caching, sending the parts of a page that are ready first, and showing the result of an action before the server confirms it all shorten the wait itself. We wrote about that last one, and where it stops being safe, in optimistic UI for AI agents. And when the wait ends in a failure, the screen needs a state of its own: see what to show when a request fails and the four empty states every screen needs.
Sources
Frequently asked questions
Sometimes, and less often than their popularity suggests. In Viget's test of 136 people, the skeleton screen made the same wait feel longer than a spinner or a blank screen did. NN/g recommends them for full-page loads under 10 seconds, where they show the structure of what is coming. They work best on layouts people already know and on placeholders that match the final page exactly. A generic grey grid on an unfamiliar screen tells the user nothing.
Below one second, show nothing: NN/g's guidance is that a looped animation shorter than a second distracts, because it flashes faster than people can follow. We hold the indicator back for the first few hundred milliseconds, so fast responses never show one. Once it appears, we keep it on screen for a short minimum, around half a second, so it doesn't blink on and off. If the request can run past ten seconds, design the next state as well: a line about what is still loading and a way to cancel.
It depends on the shape of the output. When the answer streams as text, the arriving words are the indicator, so the work is to get the first ones on screen quickly and show a small cue until then. When the job has known steps, such as reading files and then writing a summary, show the step it's on. When it runs for minutes, treat it like an export: run it in the background, show progress where the user can find it, and tell them when it's done.
The grey shapes are visual, so a screen reader user gets nothing from them. Mark the loading region with aria-busy="true" while content arrives and set it back to false when it lands, and hide the placeholders themselves from assistive technology with aria-hidden. If the skeleton shimmers or pulses, respect the prefers-reduced-motion setting and show a still version. Spinners need the same care: give them an accessible name such as "Loading results" so the state is announced.
Related articles
August 31, 2026 · 9 min read
August 27, 2026 · 7 min read
September 13, 2026 · 9 min read