Industria: a manufacturing cockpit, eight modules, one team
A six-line plant in Brescia ran on spreadsheets, Telegram screenshots and a paper kanban. We replaced the lot with a single operations cockpit. Eight modules shipped end to end: live floor, orders pipeline, line detail with andon, multi-level BOM, warehouse bin map, quality, maintenance, reports. Both themes resolved on every breakpoint. Every ask landed in production.
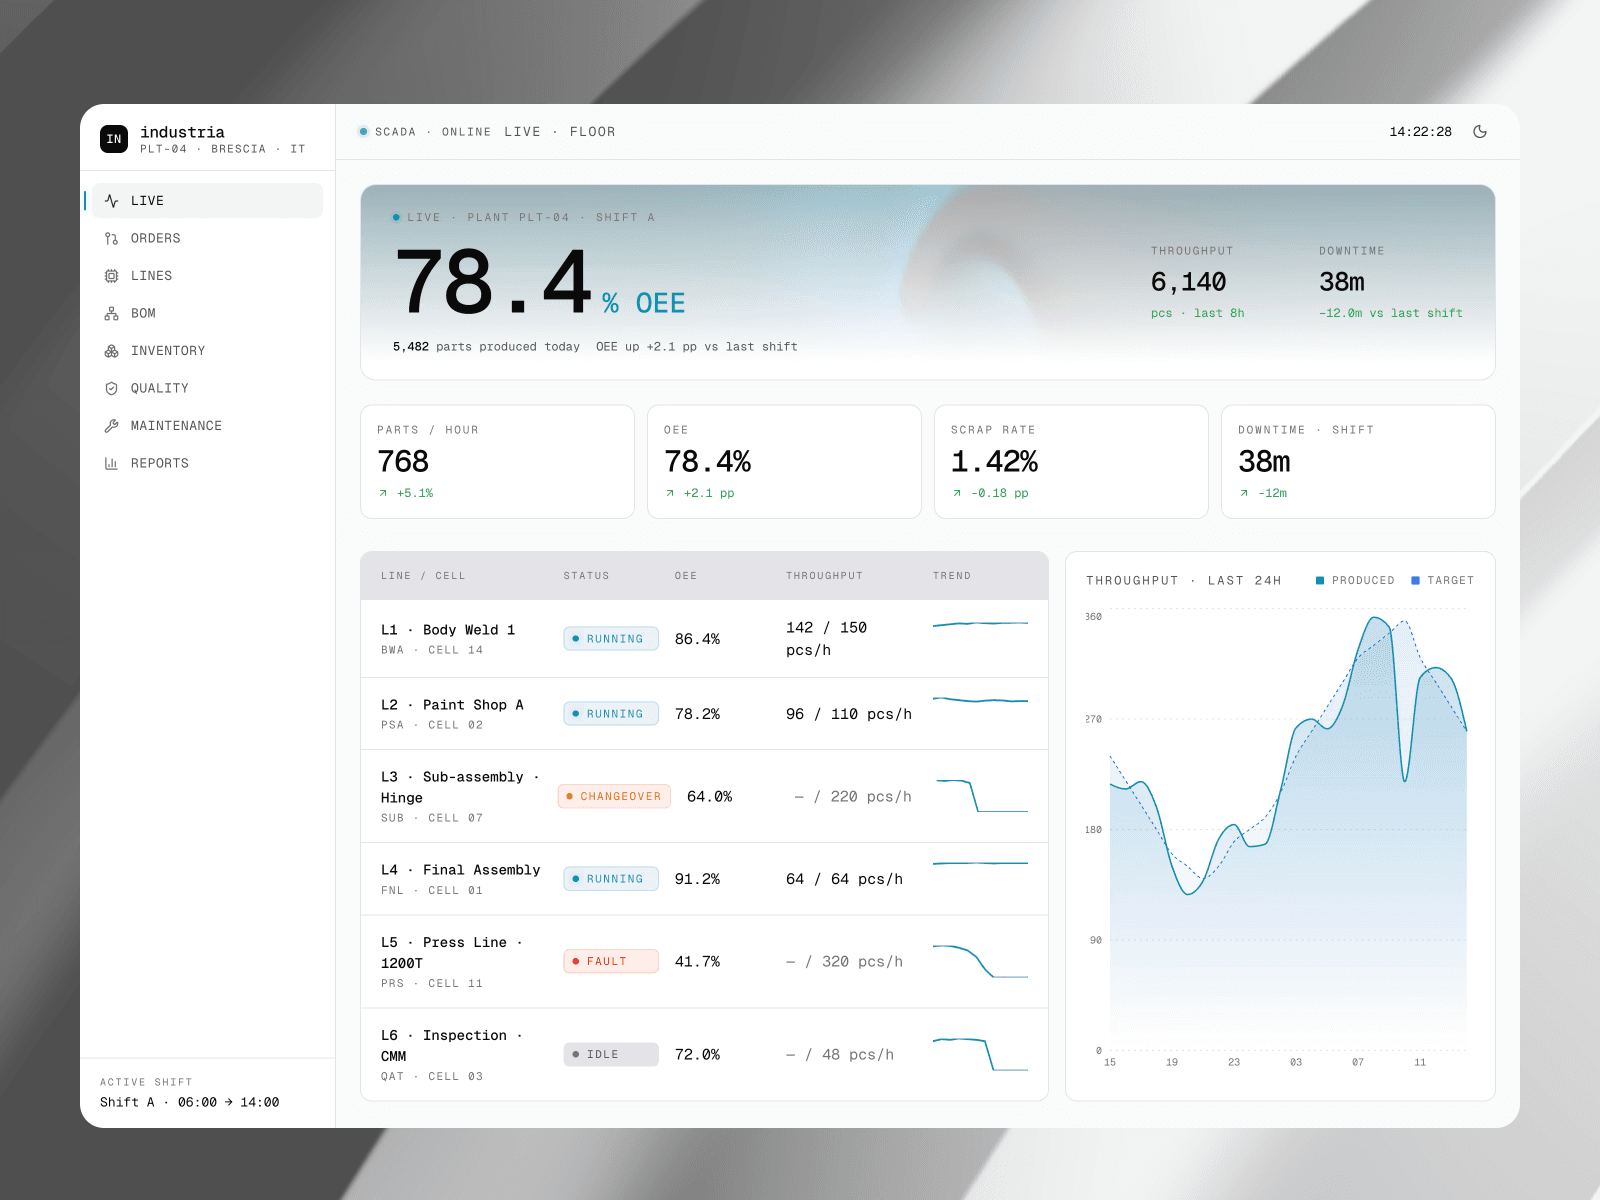
The plant runs six lines and a warehouse out of Brescia. The digital tooling we walked into was a SharePoint of fourteen spreadsheets, a Telegram group for shift handover, and a paper kanban tacked to the wall by the press line. The shortages caught at assembly stage every other week were the same shortages anyone in purchasing could have read off the BOM three days earlier. The brief opened with one line: rebuild the cockpit they wished they had.
Scope, eight modules
- 8ModulesLive, Orders, Lines, BOM, Inventory, Quality, Maintenance, Reports
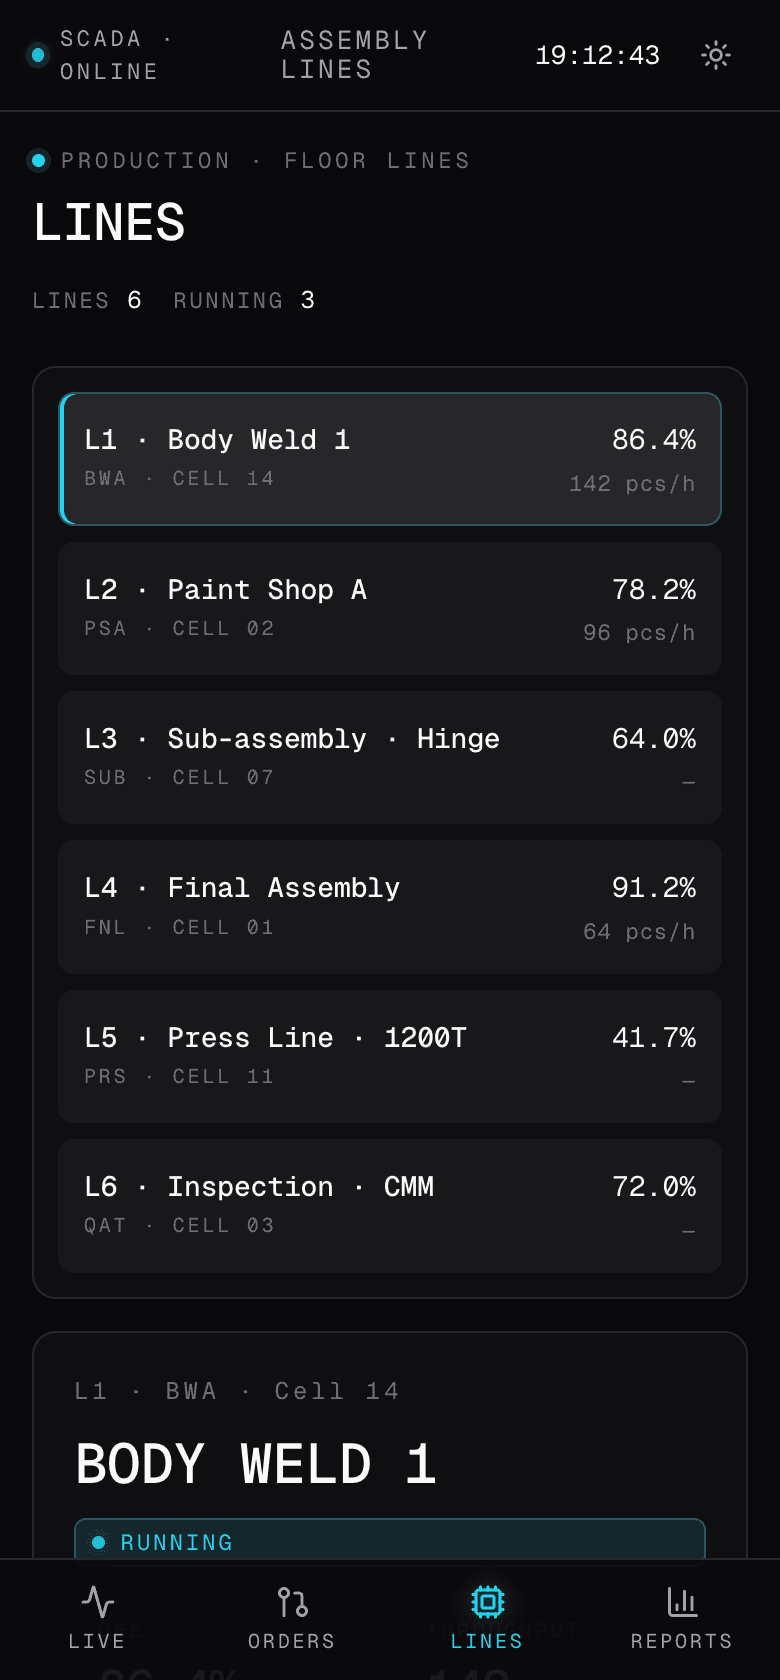
- 6Lines30+ stations live-tracked, cycle and andon per cell
- End to endBuildBrand, product, engineering, both themes on every breakpoint
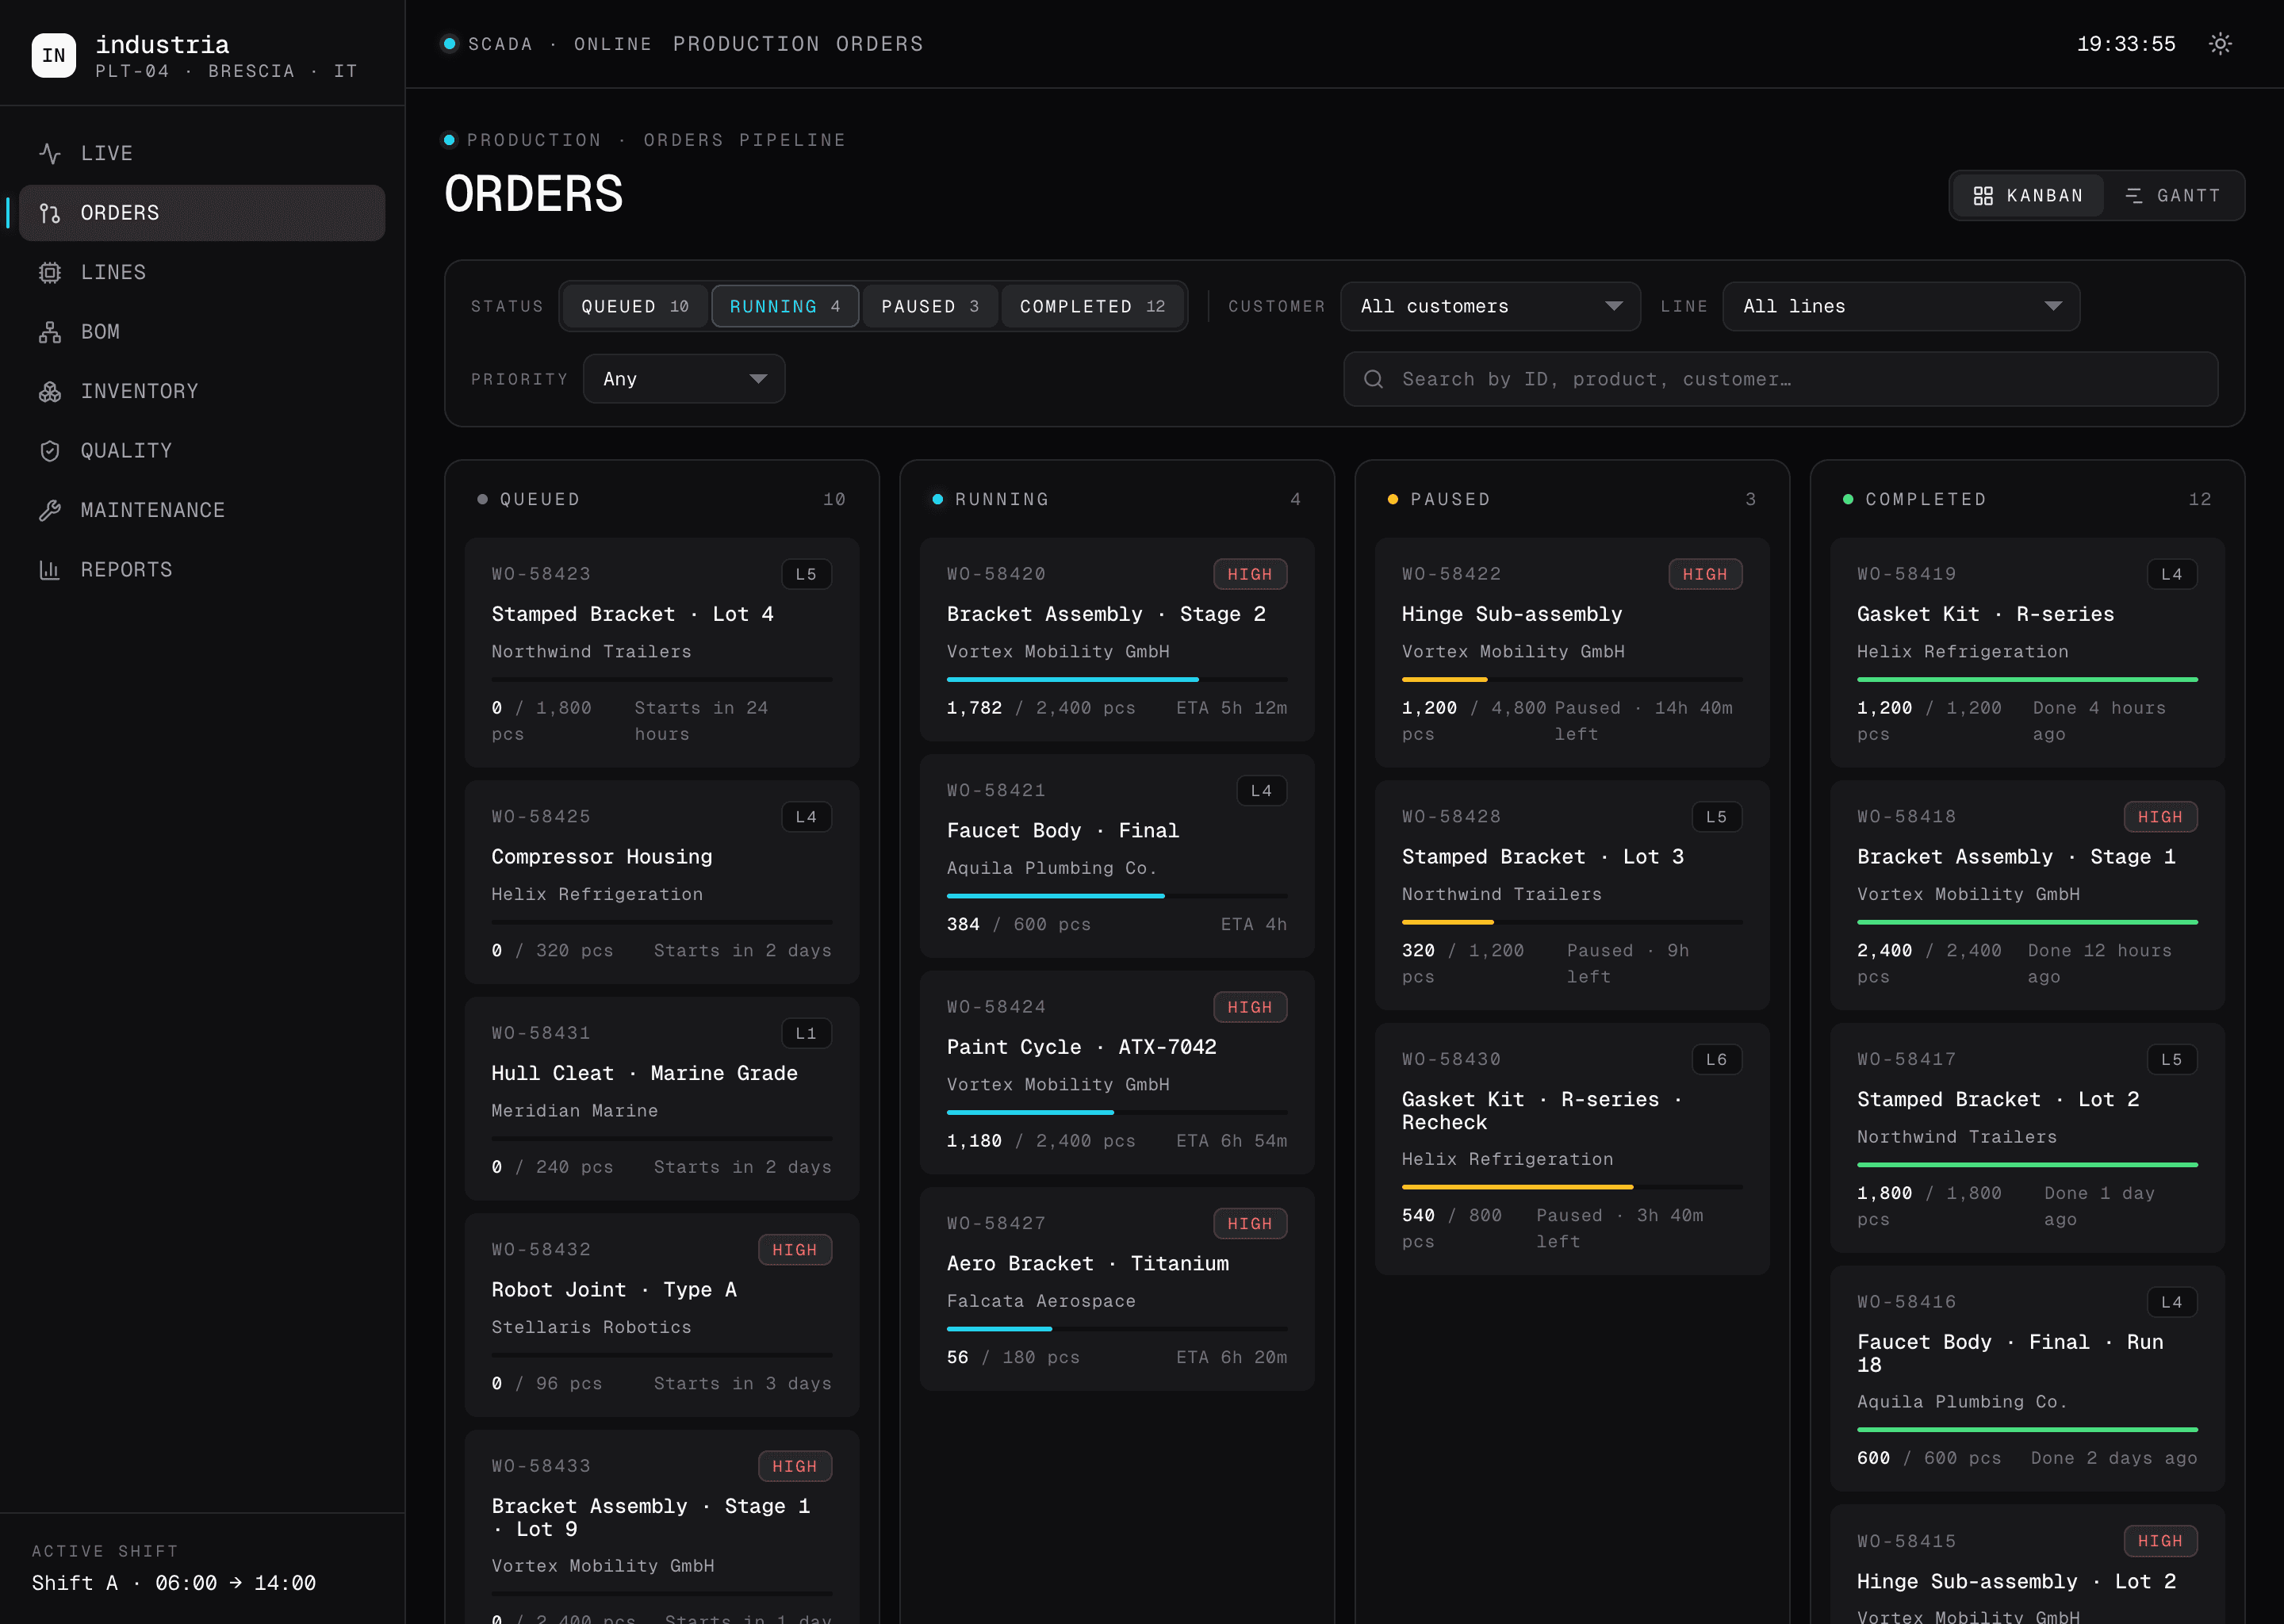
Every ask shipped
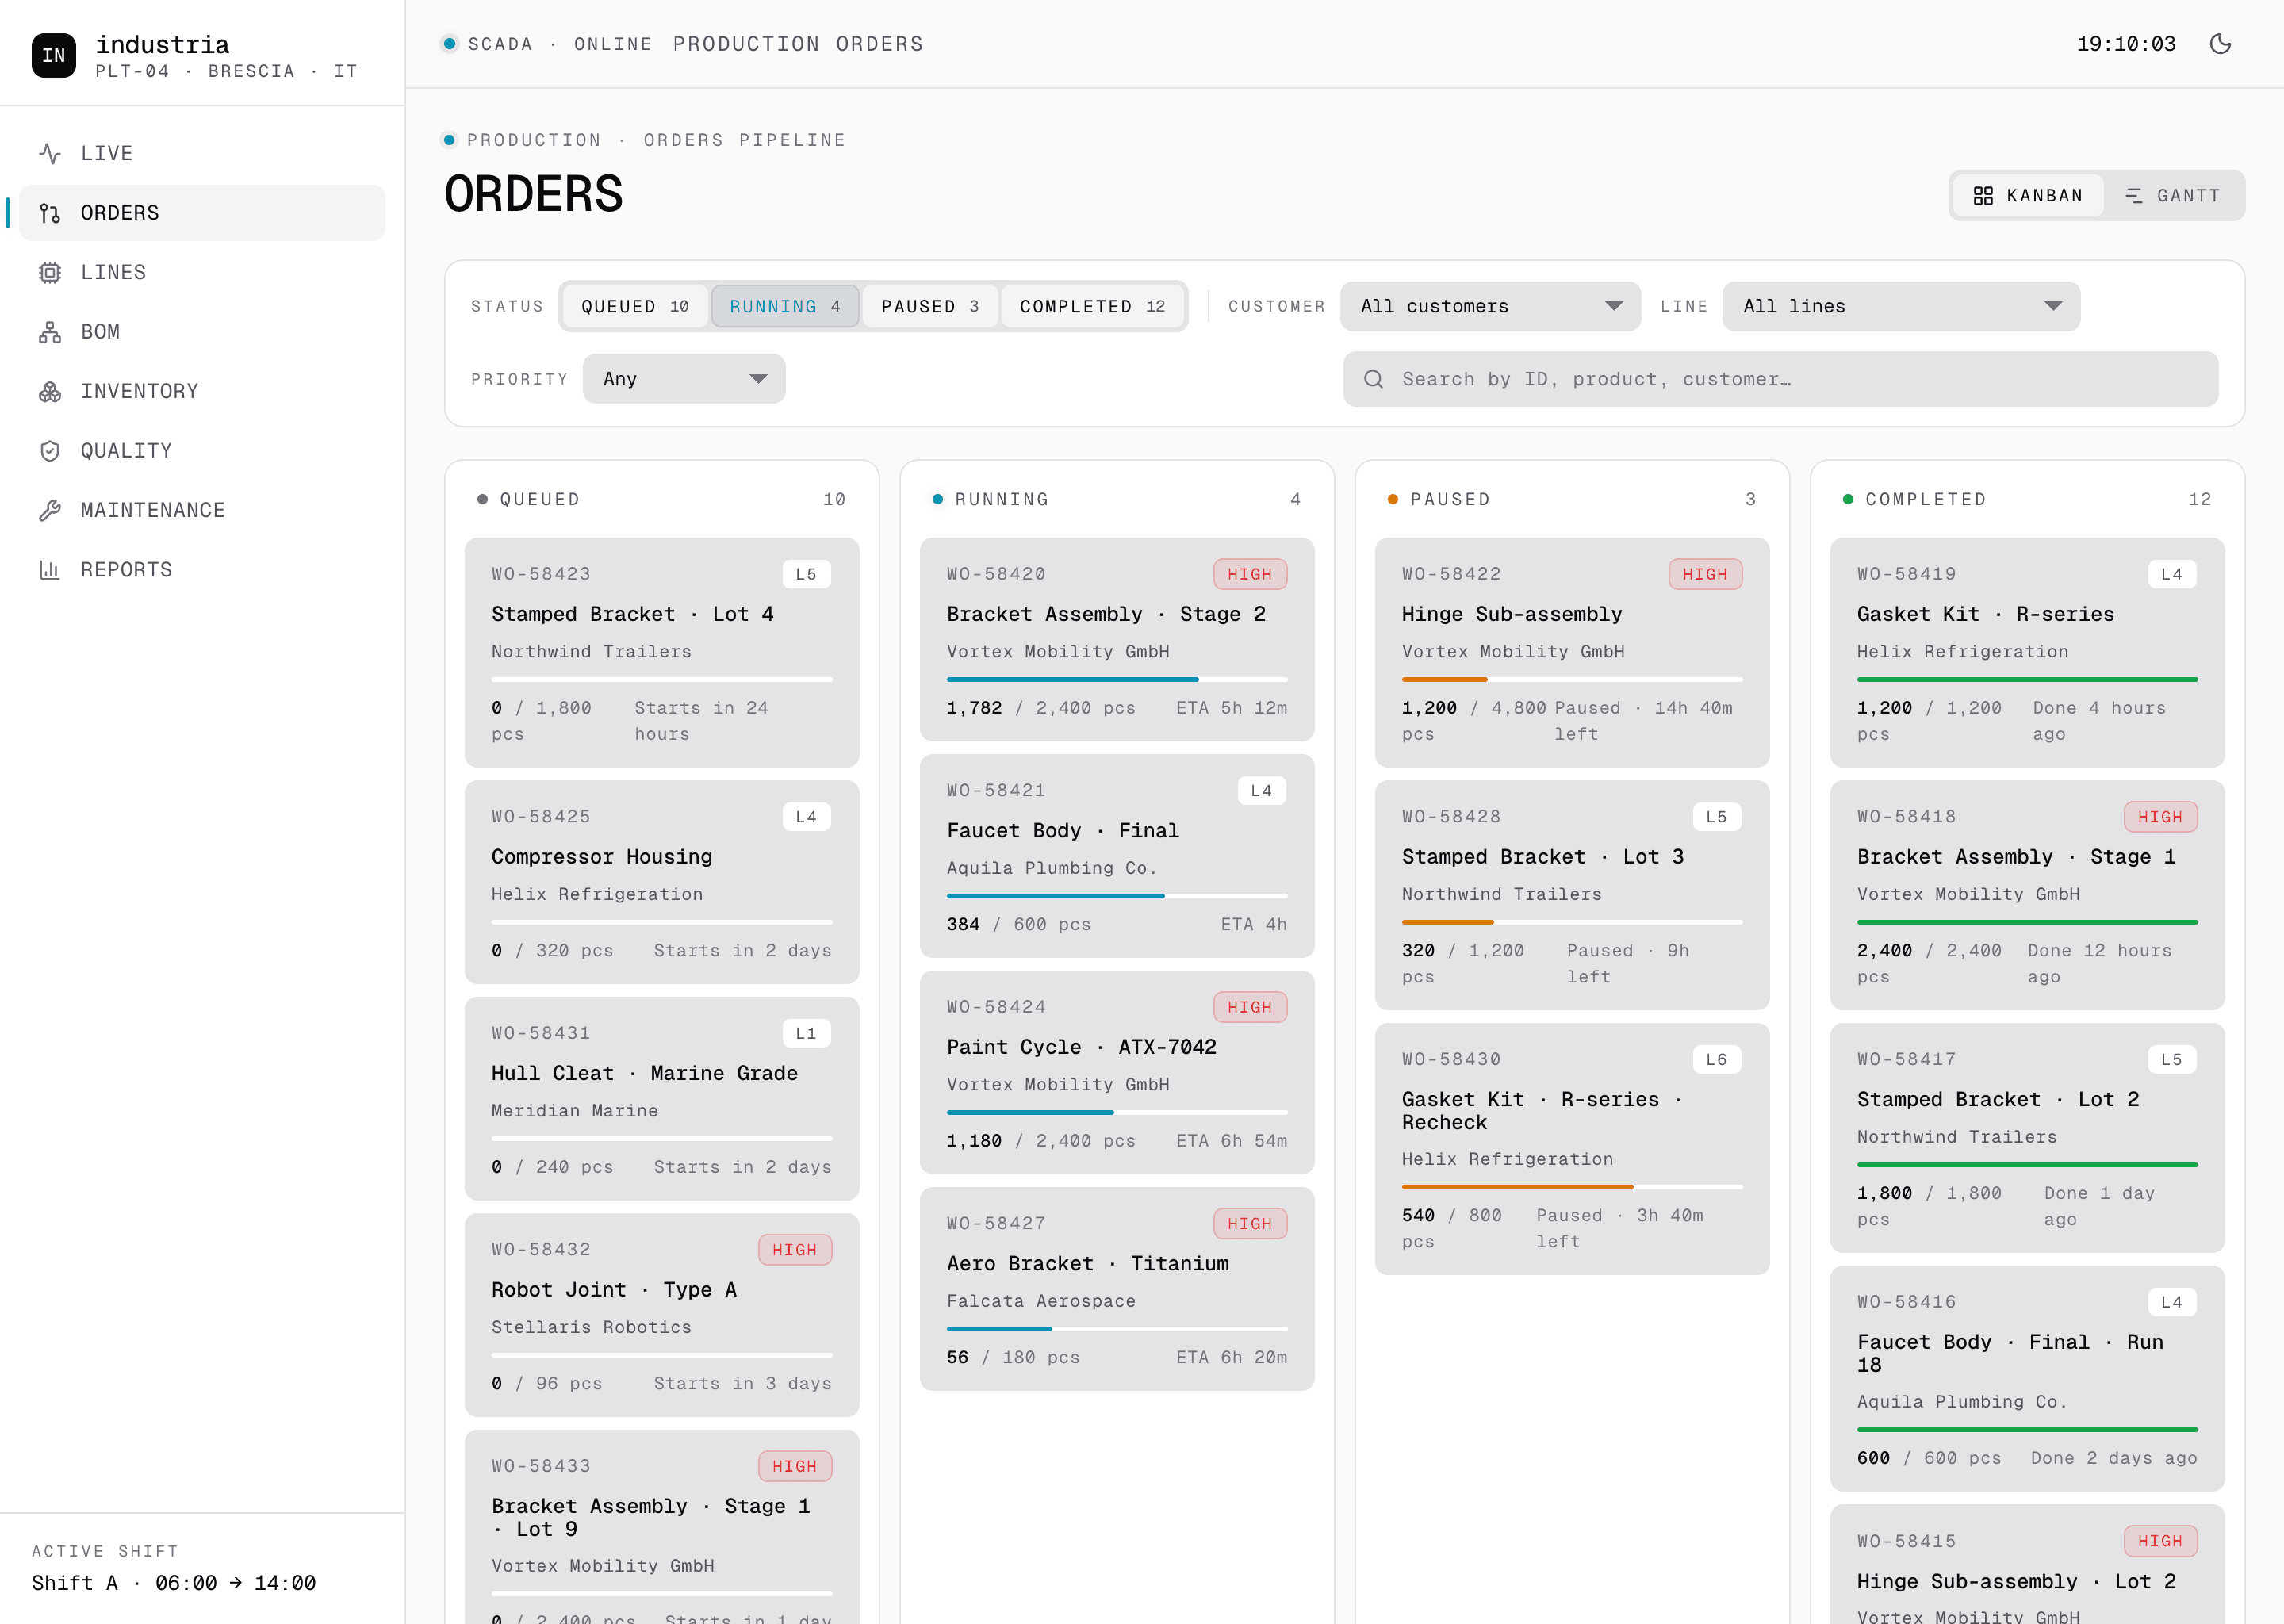
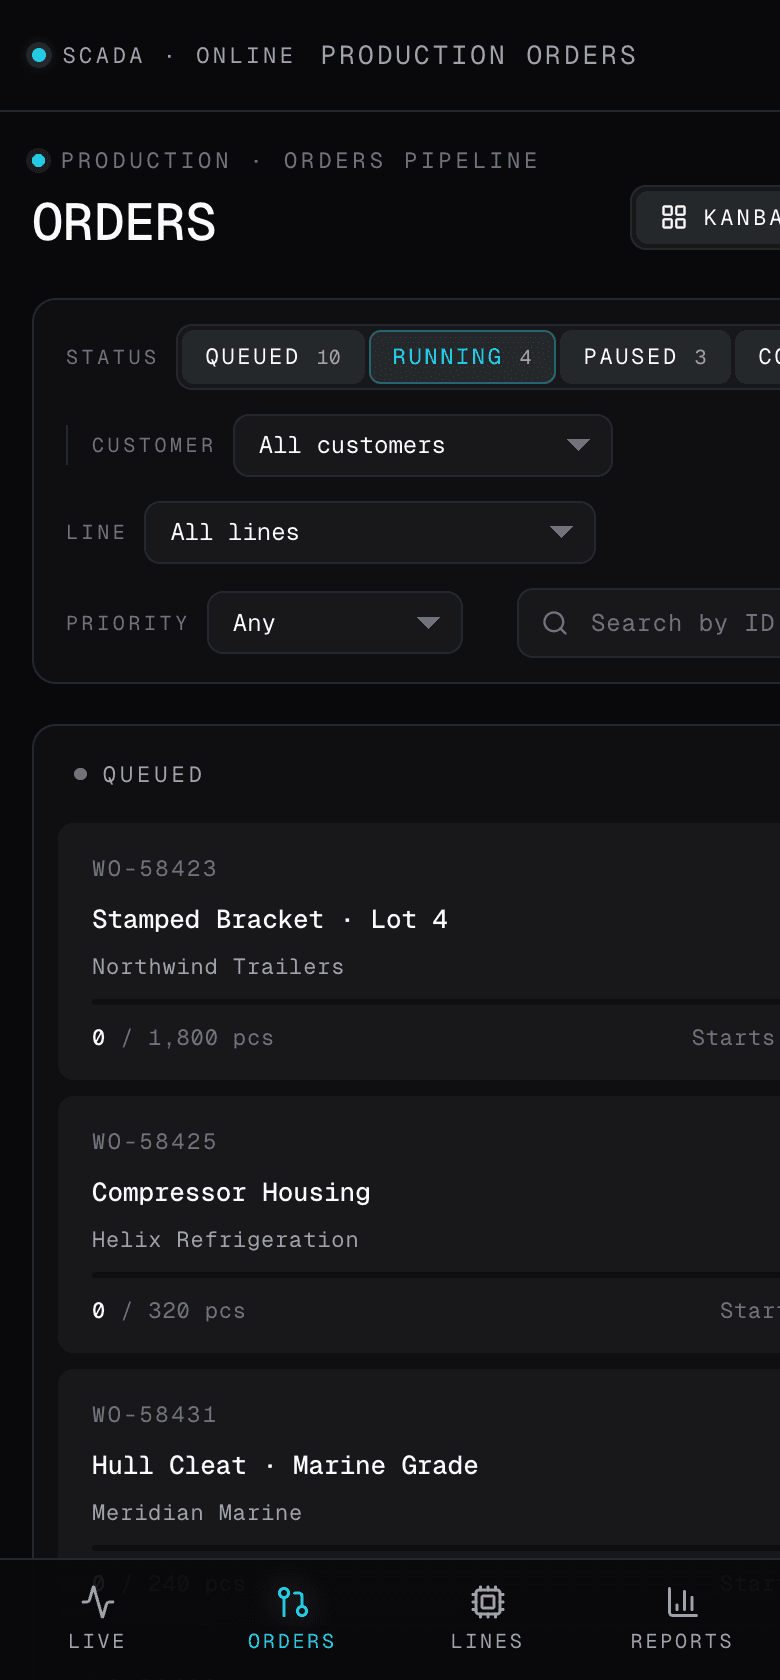
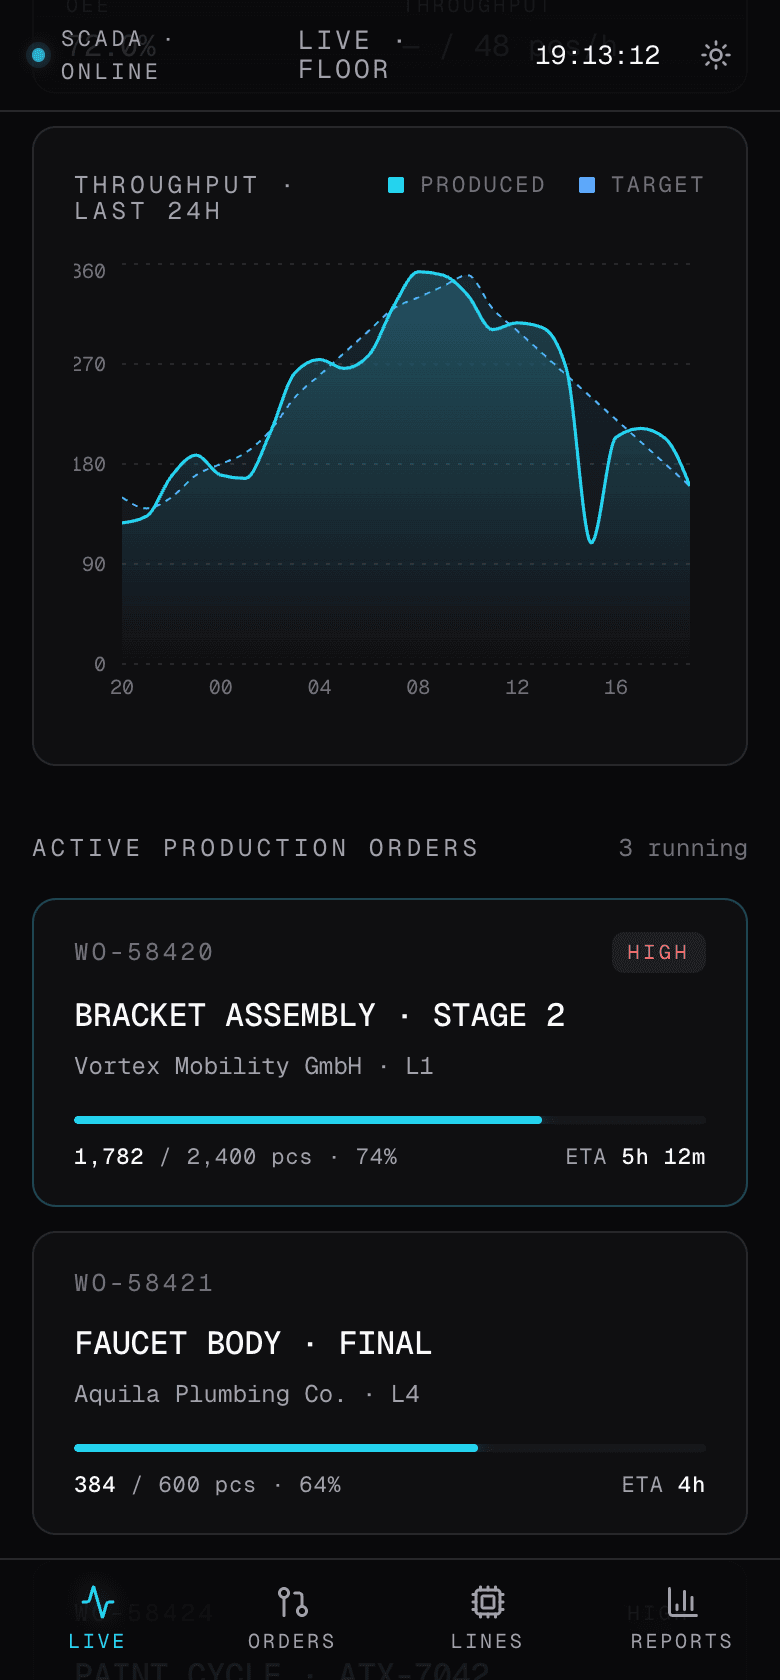
There was no scope ceiling. The brief opened on a Live floor view with OEE per line. By week two it had grown an Orders pipeline with a kanban and a Gantt. By week four a multi-level BOM with shortage propagation. By month two an Inventory sub-app with a bin map, a Quality module, a Maintenance log, and a Reports surface on top.
We absorbed every ask and shipped it. No request got pushed to phase two. No module got cut for budget. No feature came back marked out of scope. The studio stance was the same on day one and on day one hundred: if it lives on the floor, it lives in the app.
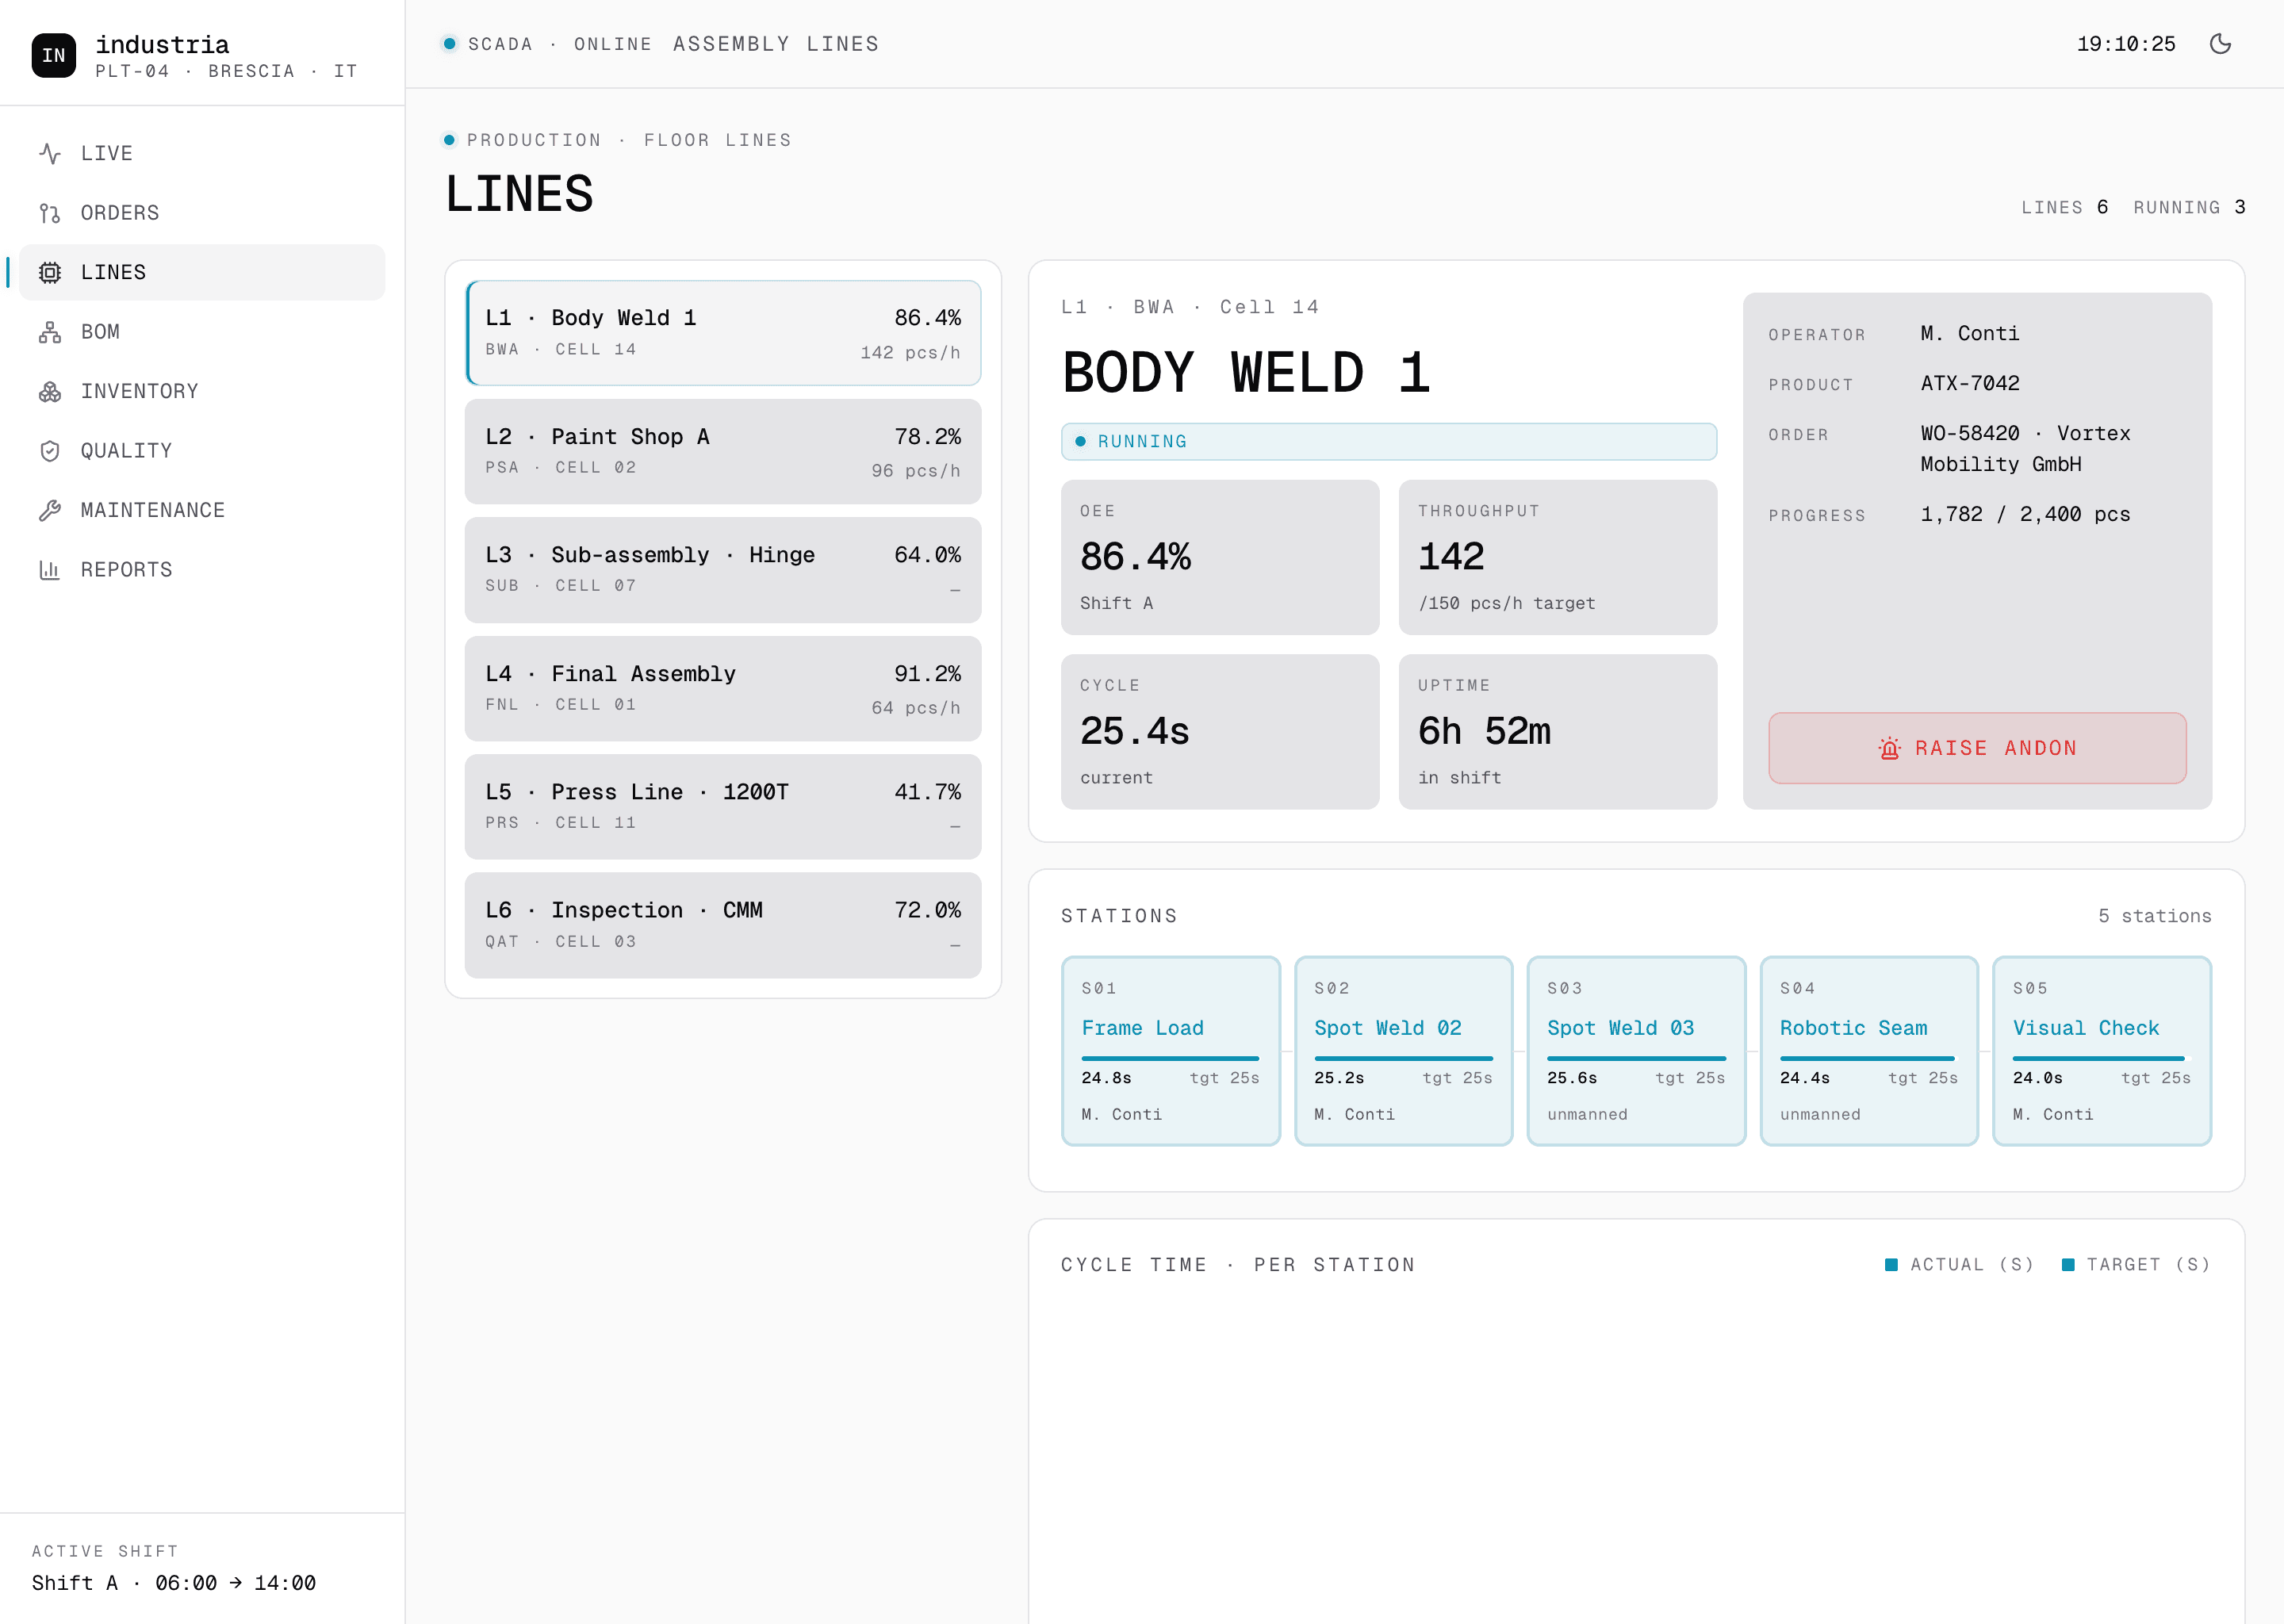
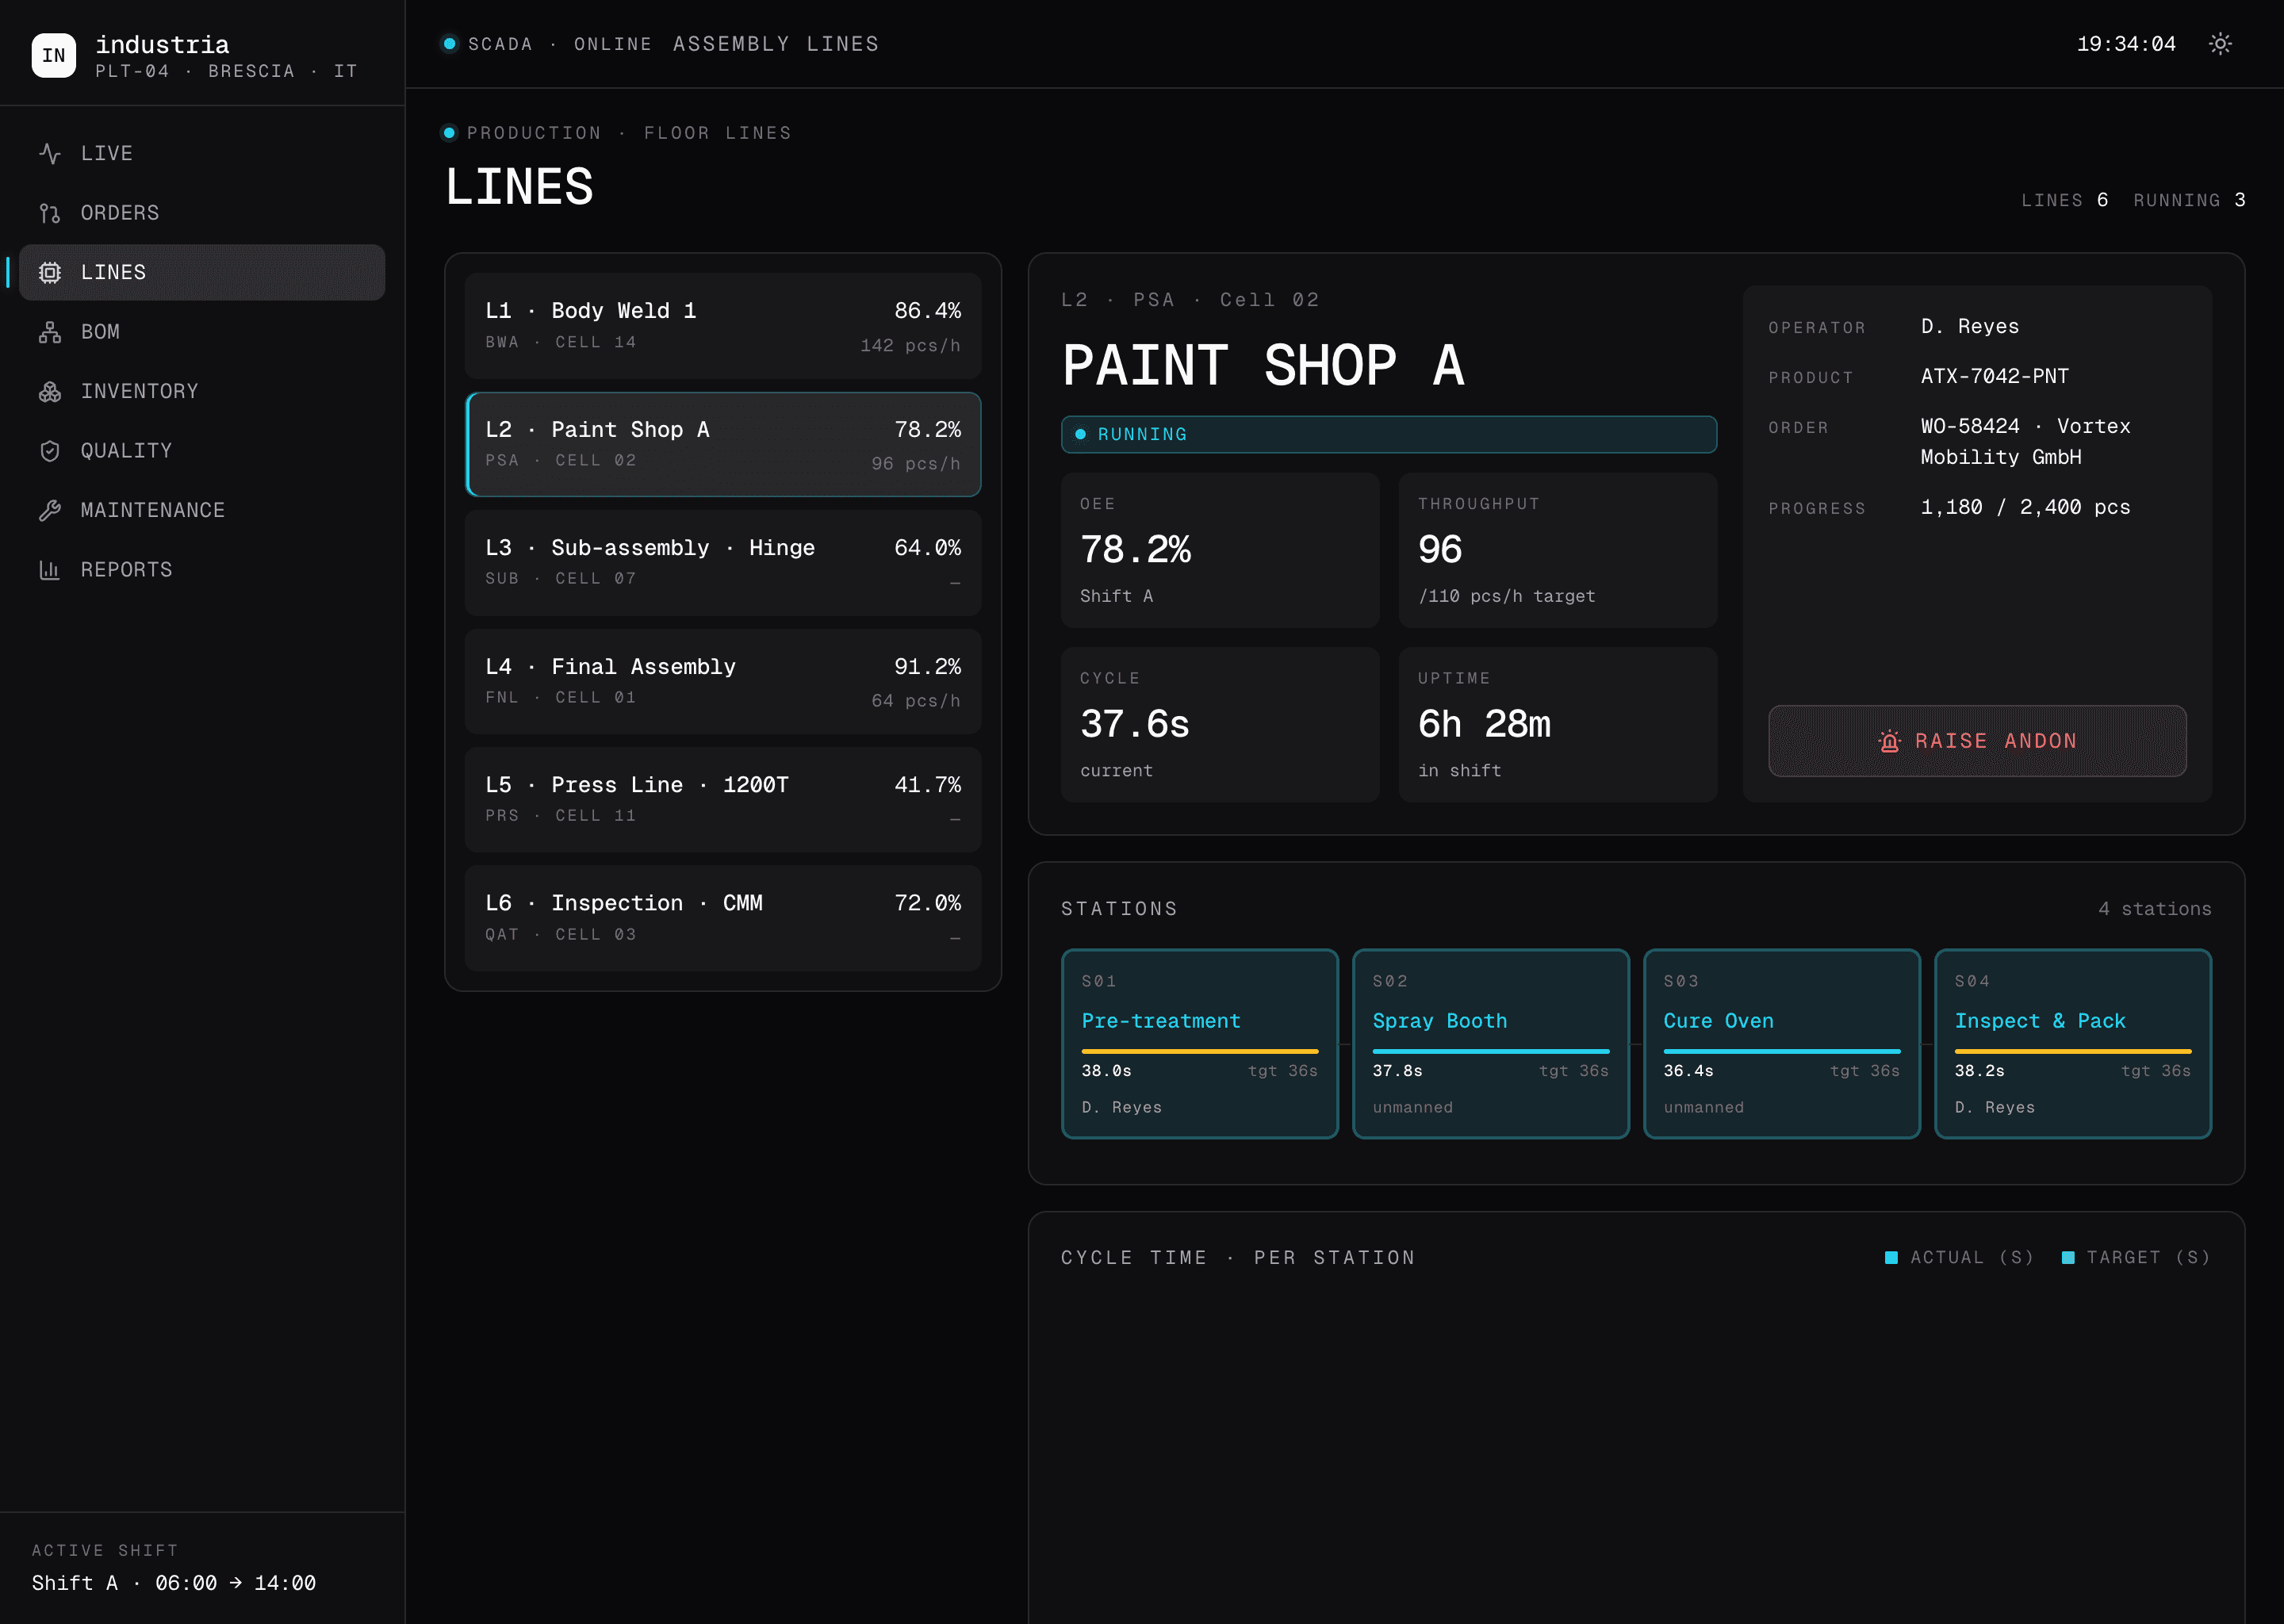
Down to the cycle, station by station
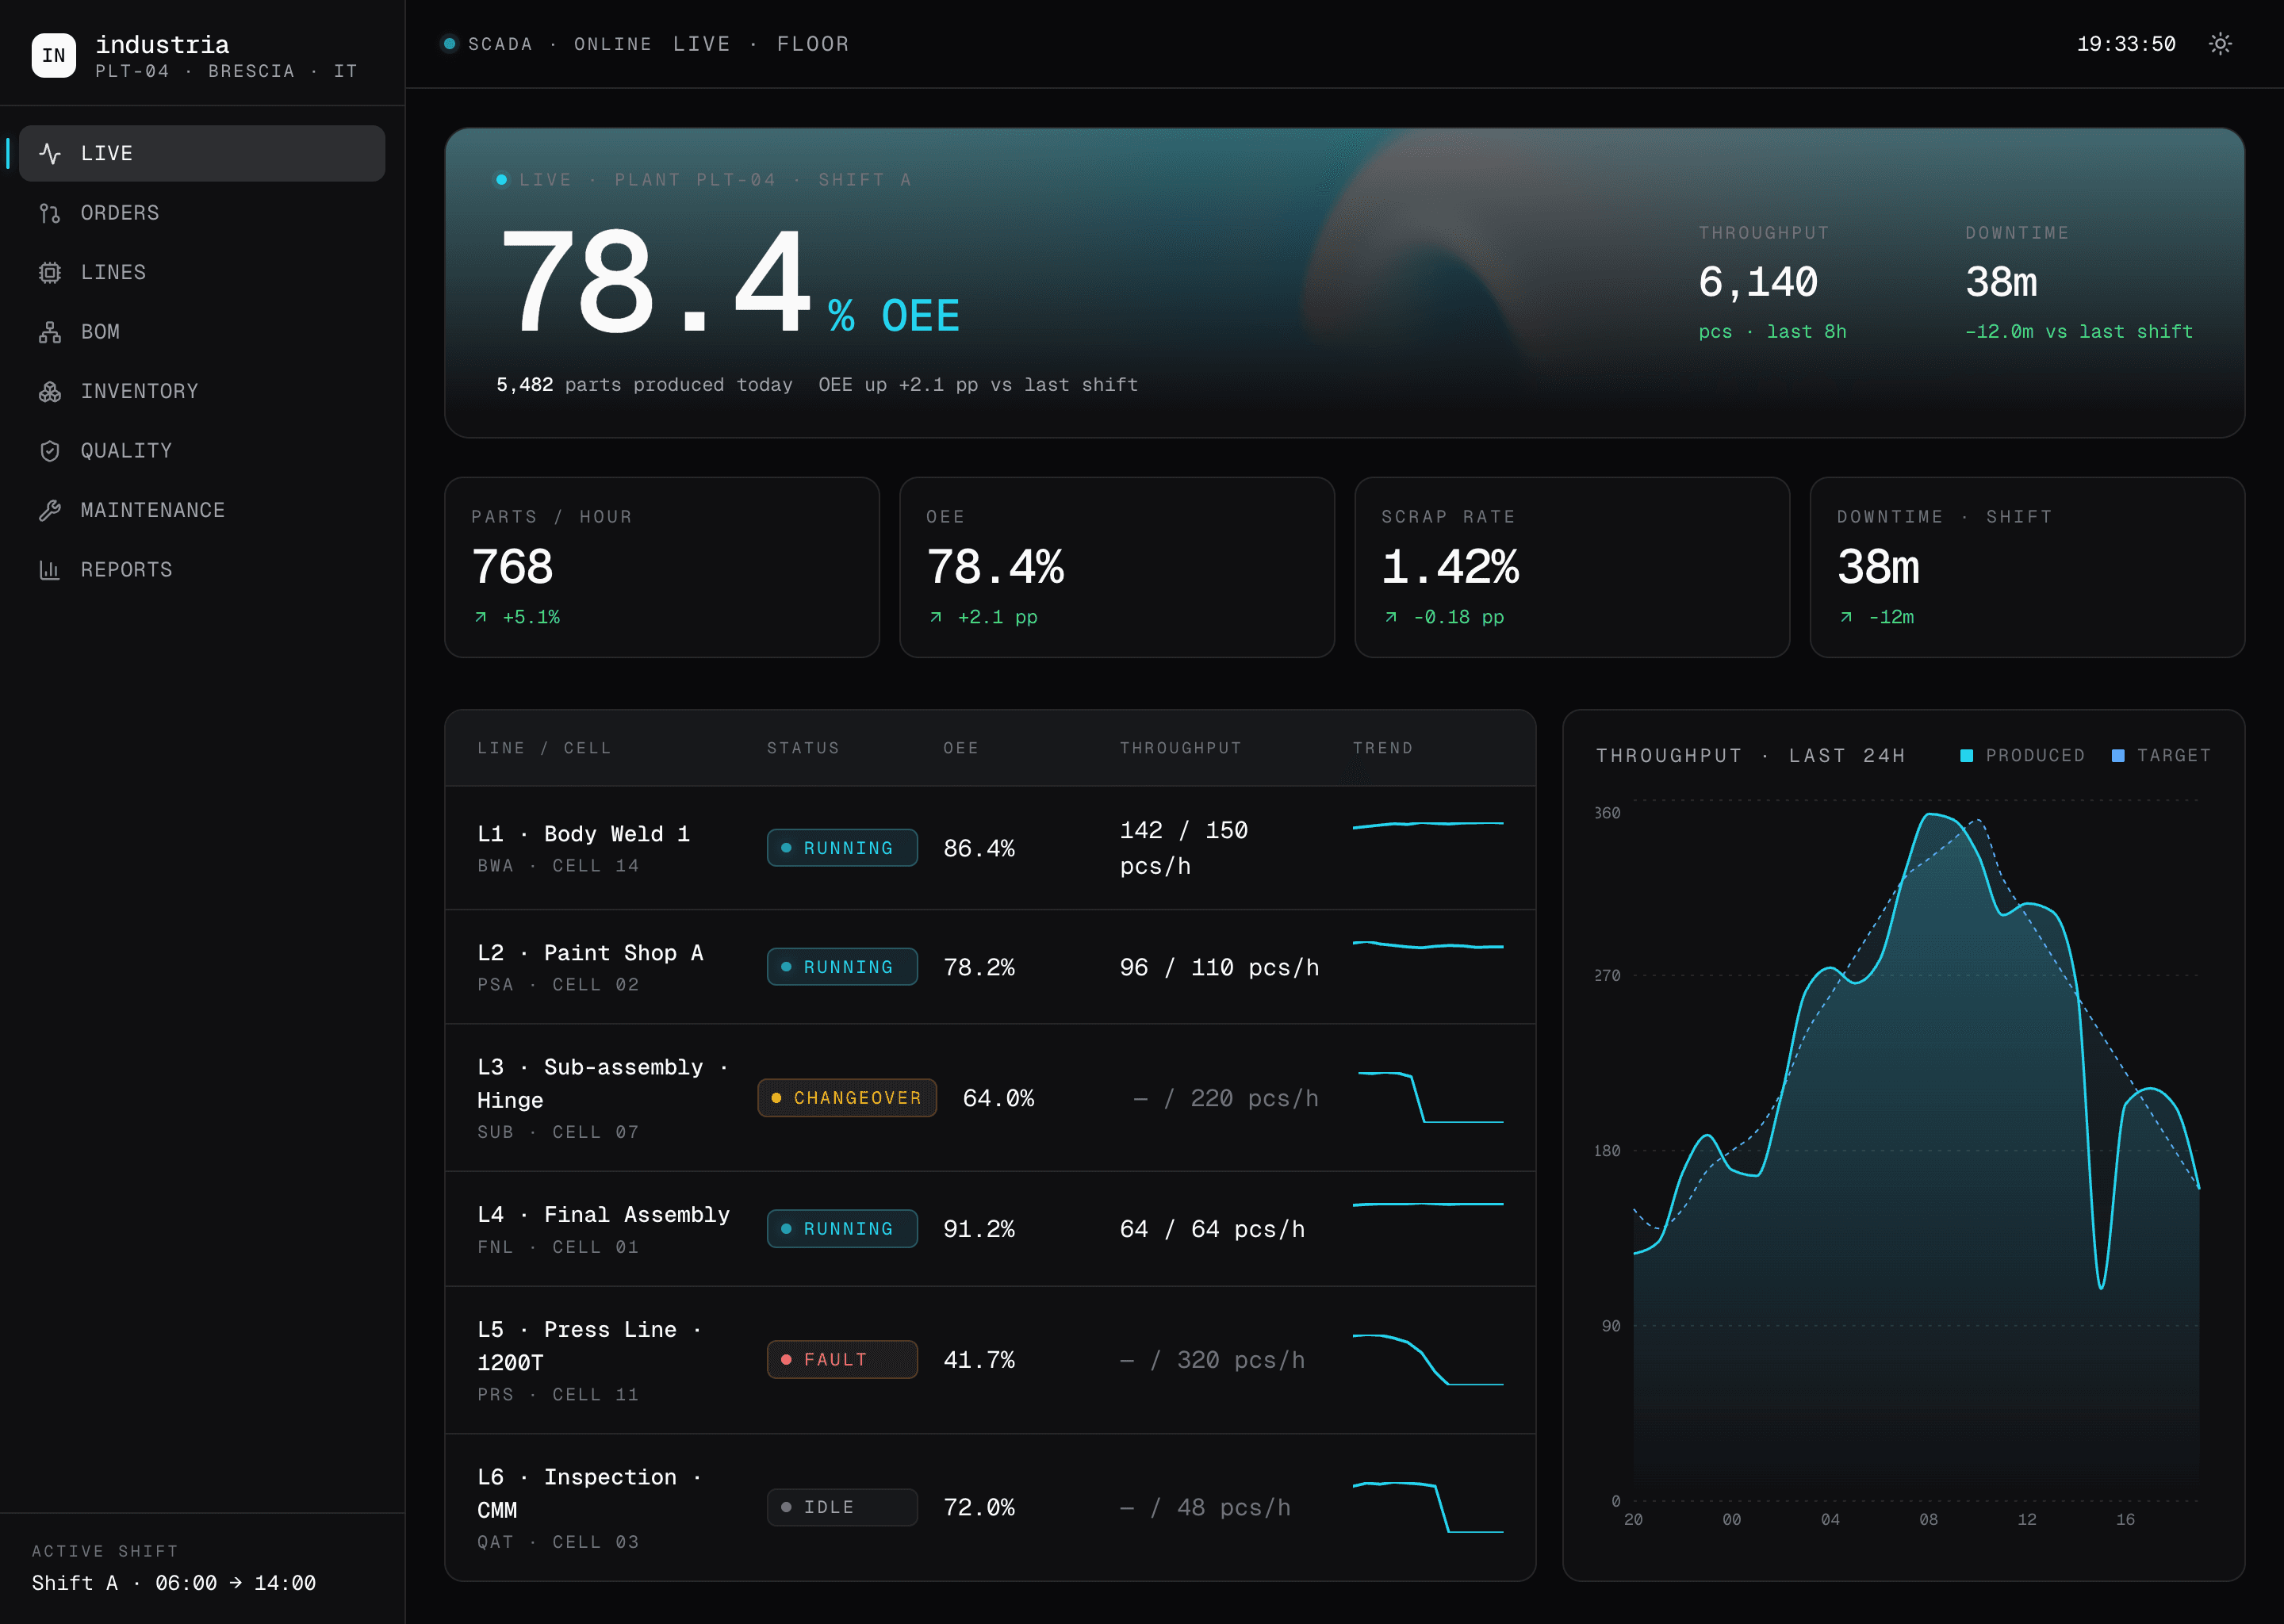
The Line detail page reads like the operator's own checklist. OEE for the current shift, throughput against target in real time, the running cycle in seconds, uptime since shift start. Beneath it, the station strip: every cell on the line with its own cycle time, its target and the operator on it.
We pushed past the dashboard tier on purpose. A line at 41 percent is one piece of information. A line at 41 percent with station S4 idle, no operator, and S2 pulling 26 seconds against a 25-second target is a different conversation. The Raise Andon button on the line header writes a real event into the maintenance queue, with the cell, the cycle anomaly and the active order pre-filled, so the operator never re-types what the system already knows.
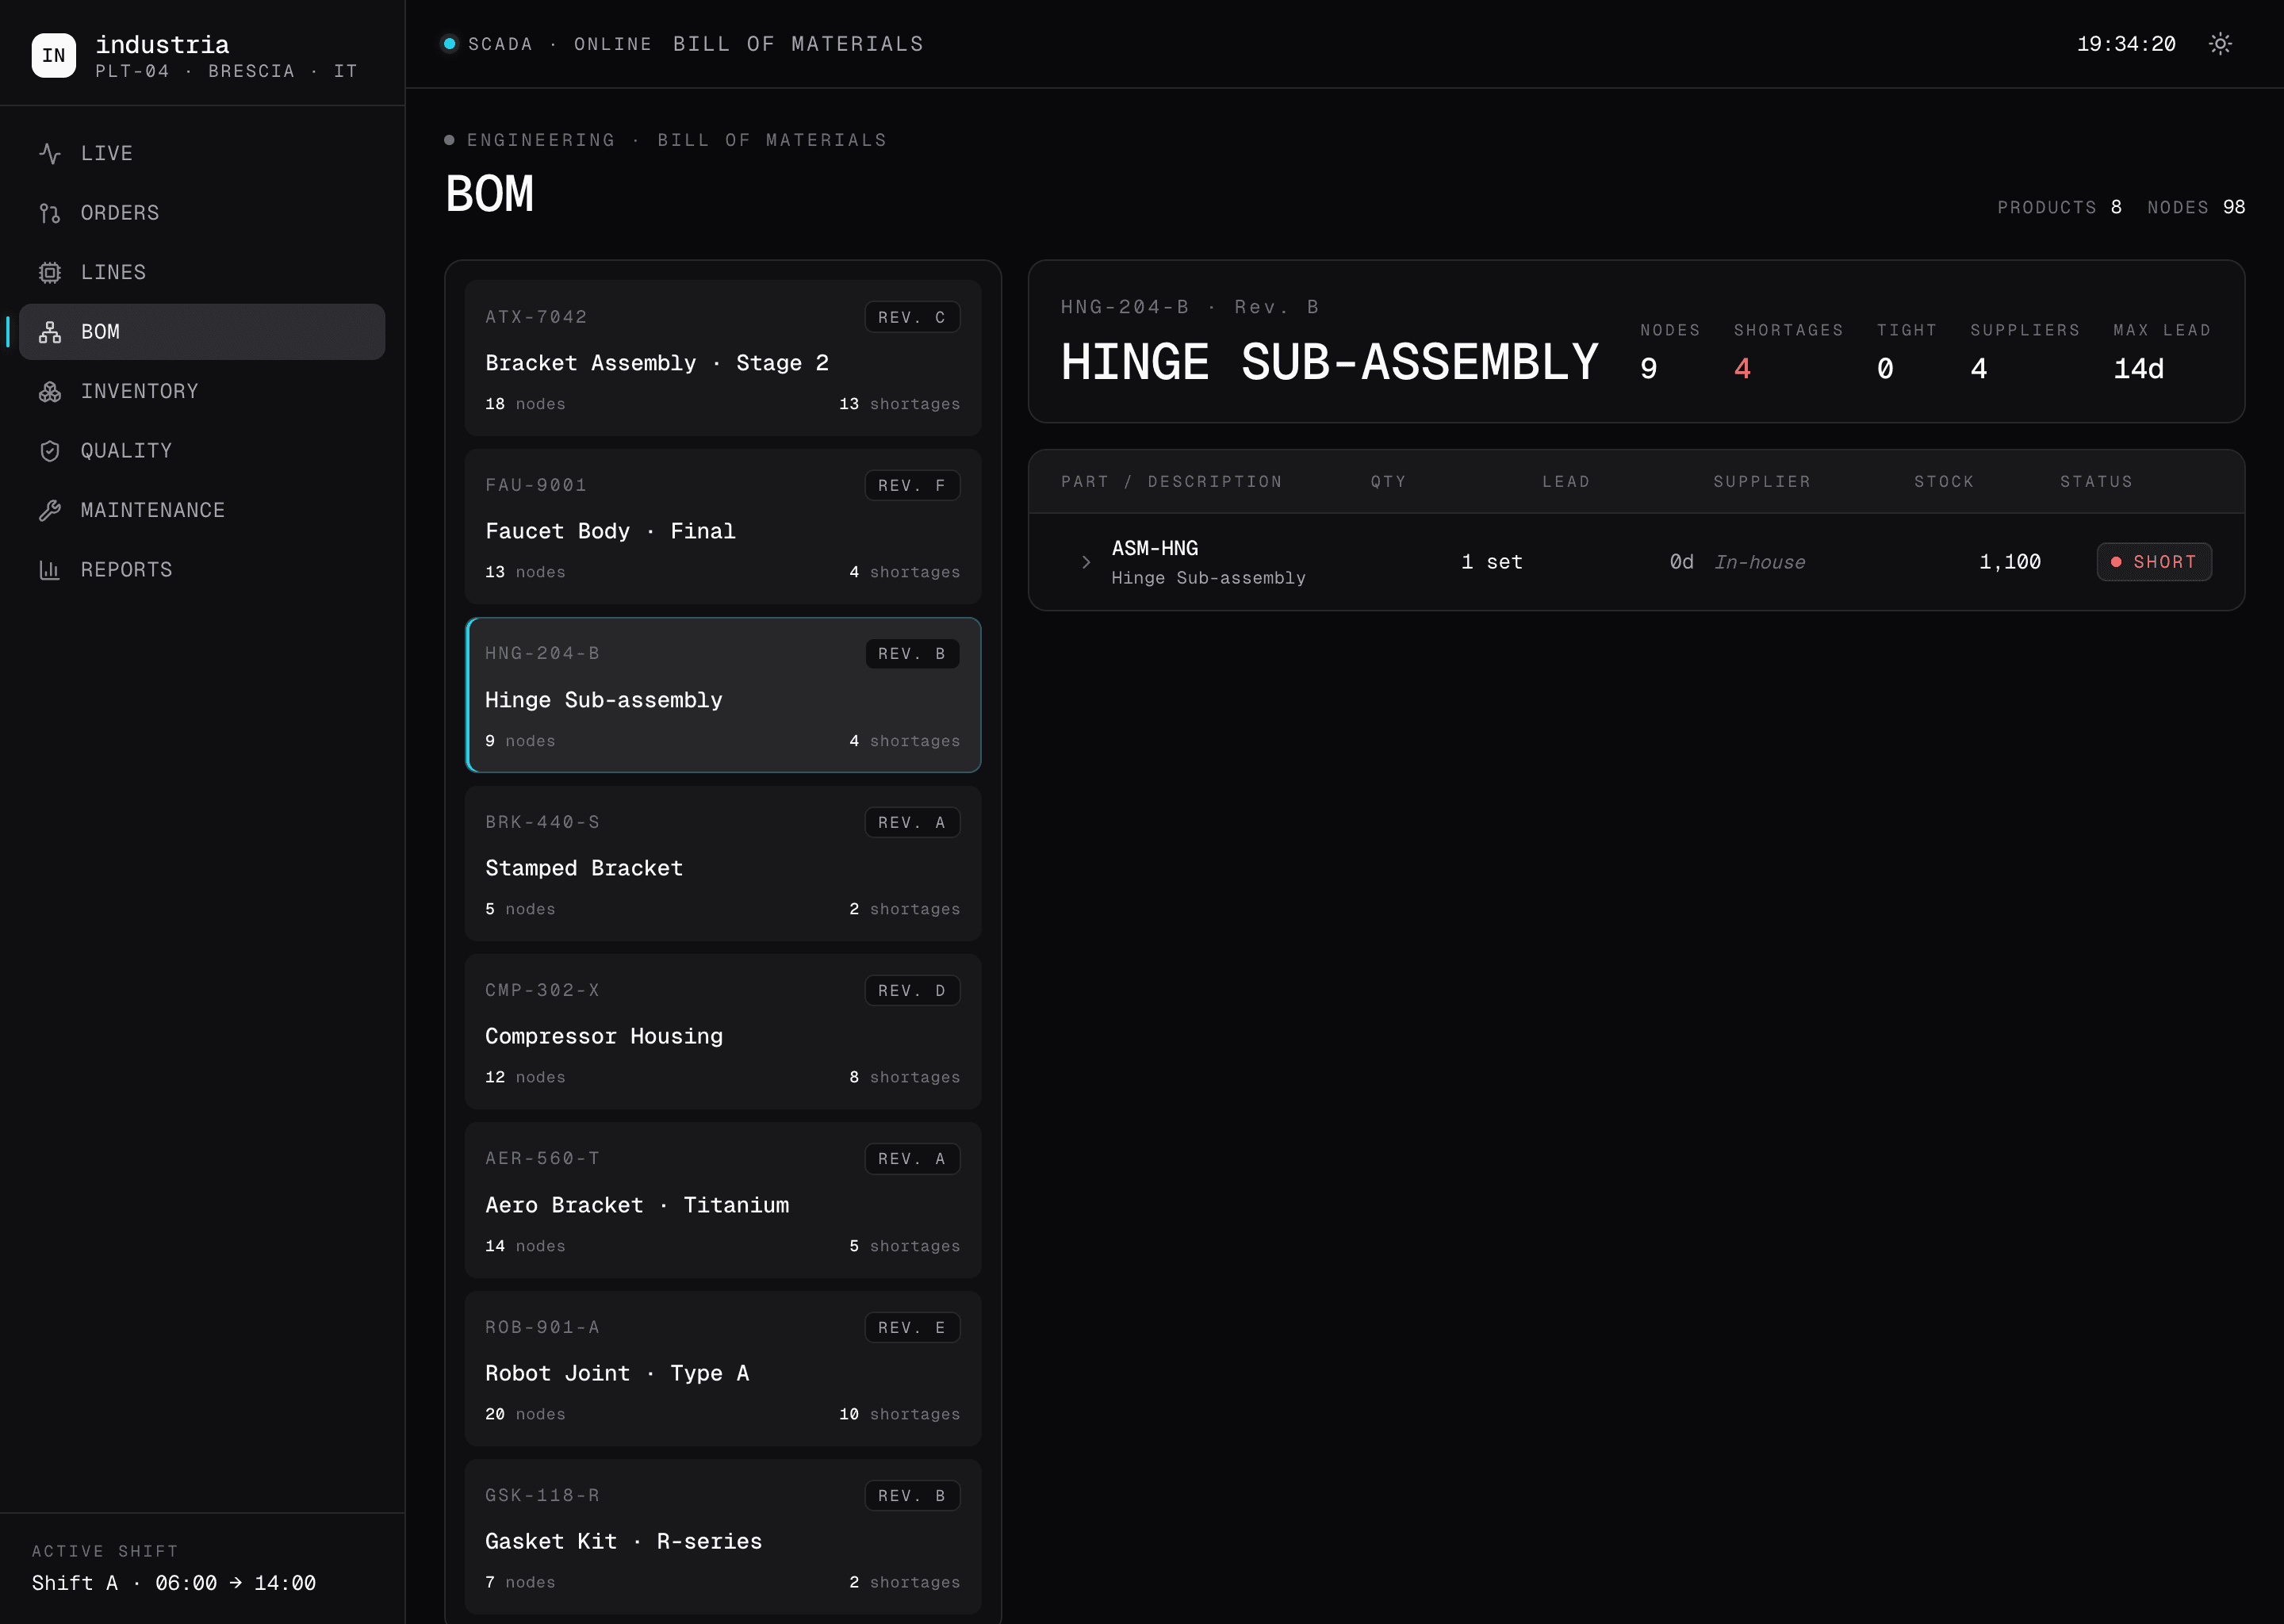
The shortage shows up before the order
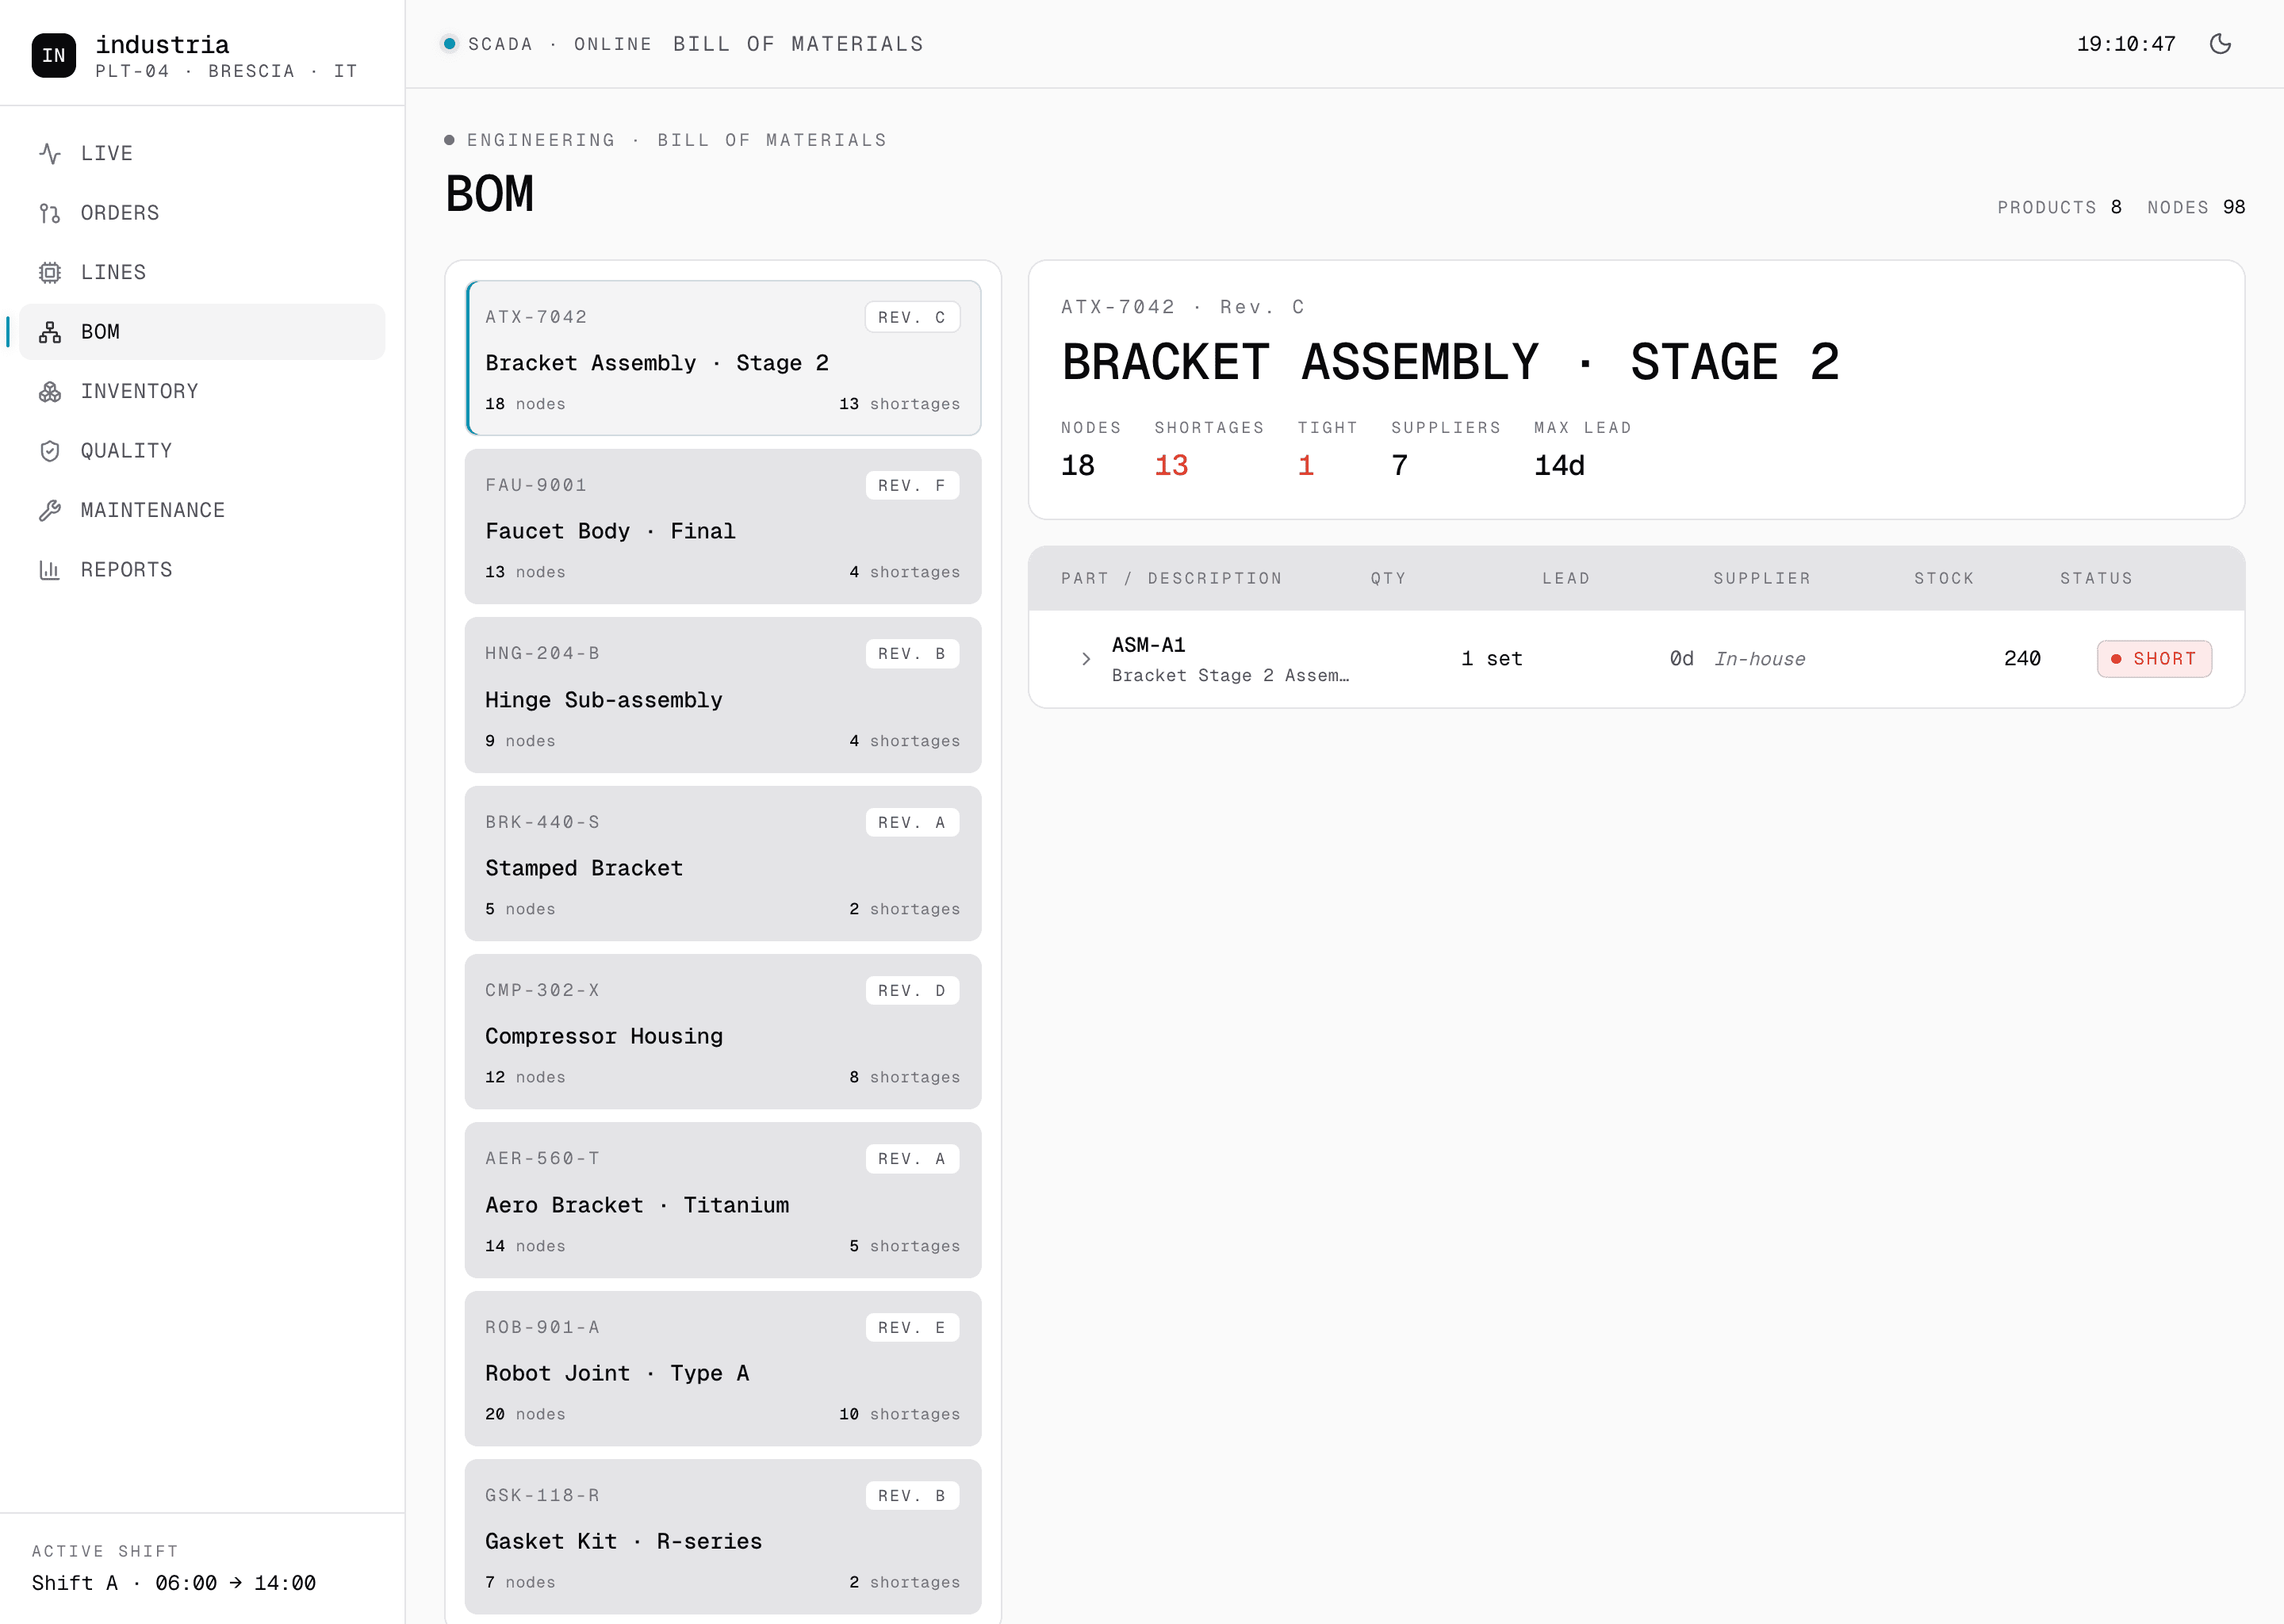
The BOM module is multi-level. Every product carries its own tree of sub-assemblies, parts and raw materials, with revision tracking and supplier lead times at every node. Shortage flags do not stay on the part where the gap shows up. They propagate up the tree to the assembly that needs them and into the orders pipeline that depends on the assembly.
A coil running short upstream now reaches the production planner before the order on the floor reads zero. The week the plant caught five shortages at assembly stage in the old system was the week we wrote the propagation. The same week, two of those shortages would already have been visible from the live BOM, with three days of lead in front of them.
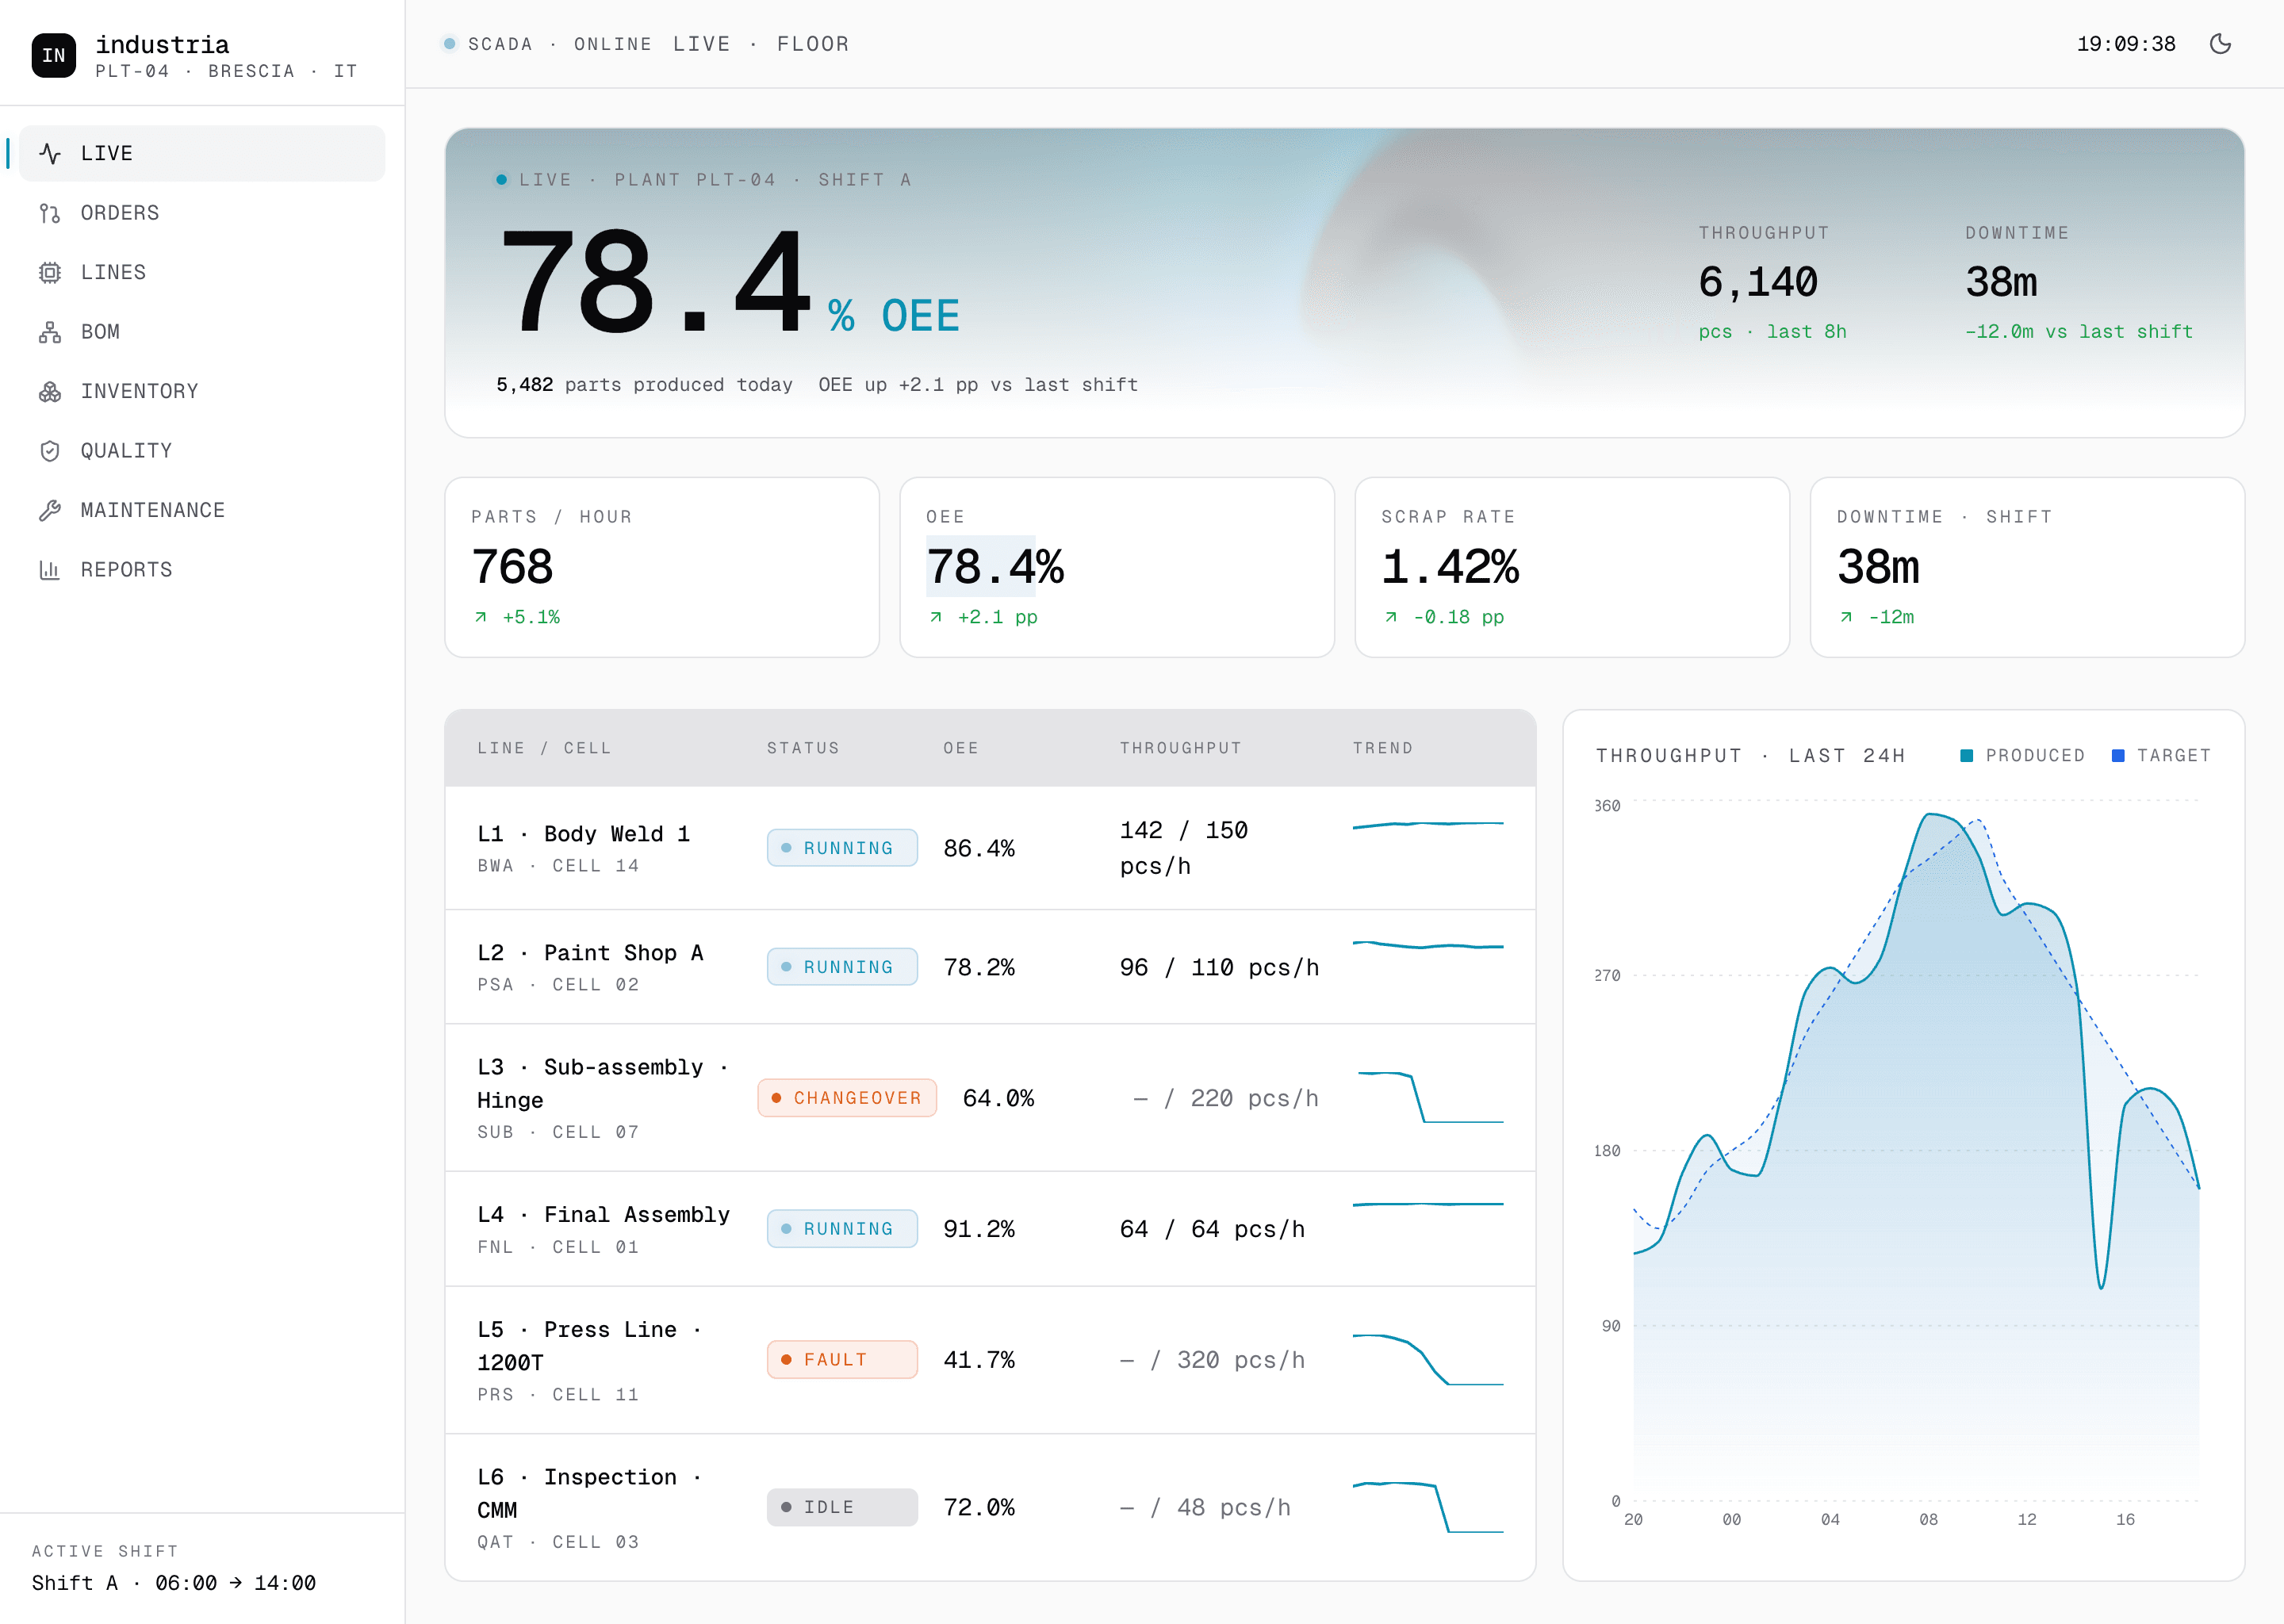
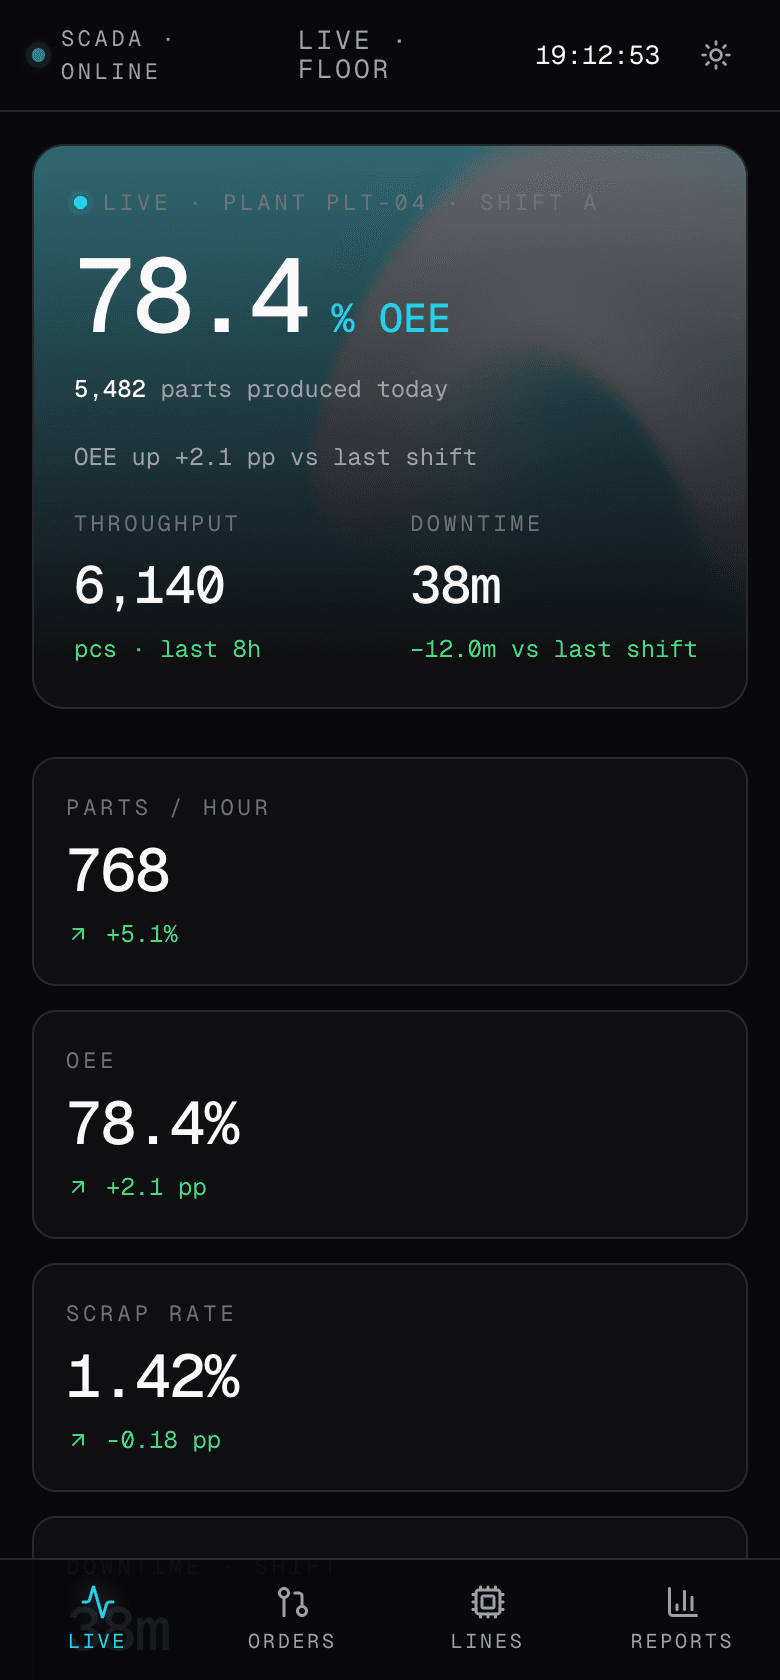
Both themes, every breakpoint
Light and dark are not a device choice. Every surface in the cockpit, desktop through phone, ships fully themed in both. The desktop modules already shown above also run in dark, the same pages with the same data and a different theme. The four screens that follow are the proof.
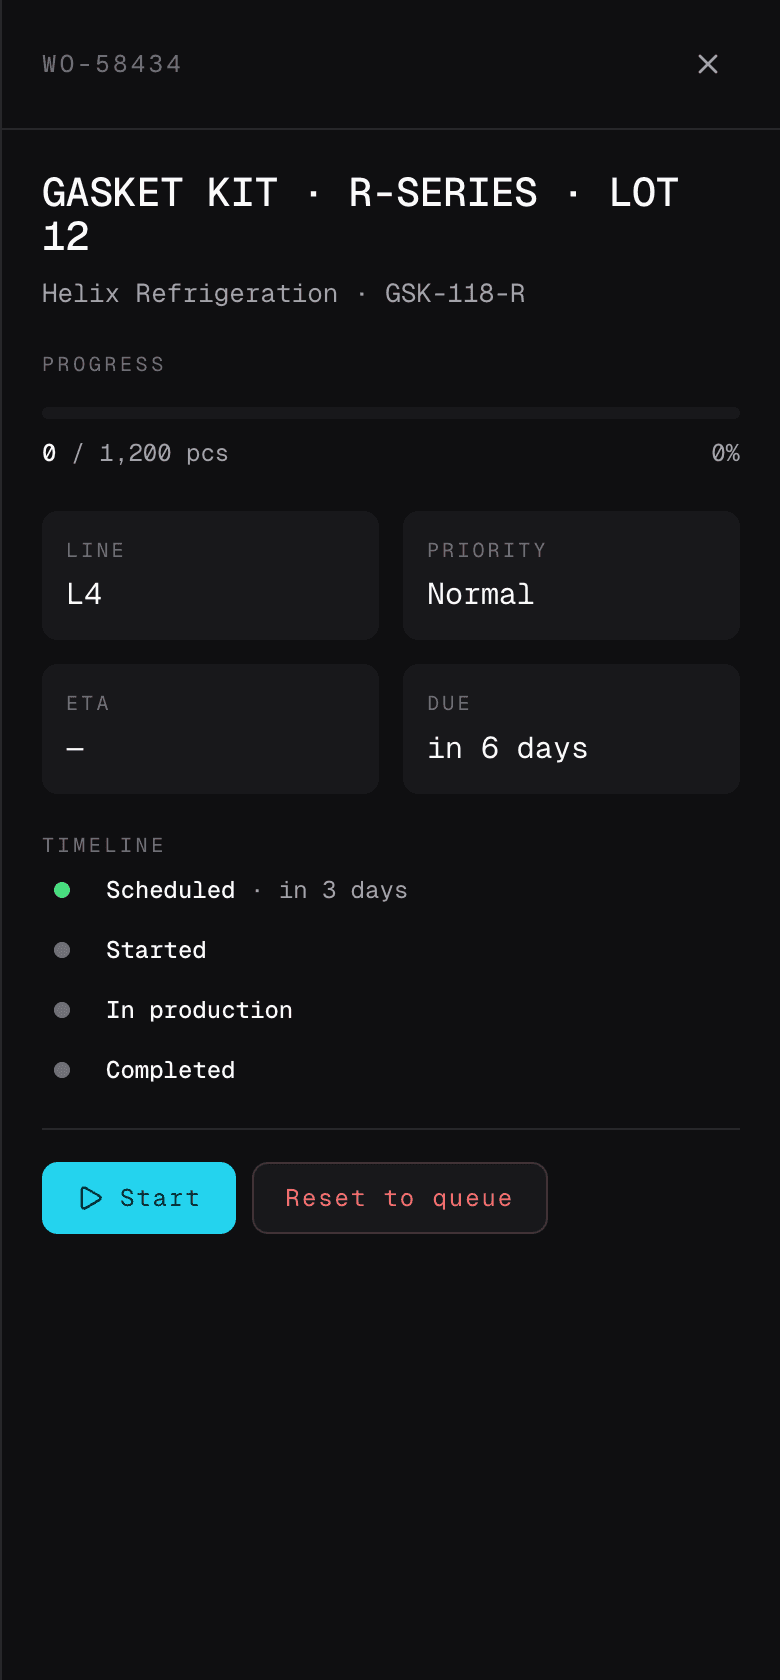
We resolved every component twice. Two distinct contrast targets, two type-weight scales, the same React components and the same design tokens powering four fully resolved surfaces. Andon, line status and order start are reachable on mobile in two taps from the home tab. The desktop has the planning surface, the mobile has the floor surface. Neither one is a thinned version of the other, and neither one is locked to a single theme.
We measured the floor one month after launch. The numbers below are the early delta against the spreadsheet-and-Telegram baseline the plant ran on before the cockpit went live. The lines, the products and the customer mix stayed the same in the comparison window: the only variable that changed was the cockpit.
One month on the floor
- +16 ppOEEFrom 62 percent average to 78 percent across the six lines
- +22%Throughput per shiftSame lines, same products, same shift length
- -35%DowntimeAndon goes straight to the maintenance queue, no re-typing
- Days → minutesShortage detectionBOM propagation reaches purchasing before the order reads zero
- 30 → 4 minShift handoverRead off the live page, no screenshots in a Telegram group
- 14 → 0SpreadsheetsThe SharePoint folder is read-only and dated
Stack
- Next.js16
- React19
- TypeScript5
- TanStack Query
- Recharts
- Postgres16
- Supabase
- Cloudflare R2
- Vercel Edge
“Eight modules, no phase two. We expanded scope four times during the build and they shipped each one on the same cadence. One month in, the cockpit already caught two shortages this month before purchasing did, and we hand the shift over in four minutes off the live page. The SharePoint of spreadsheets is in read-only and dated.”
Running operations on spreadsheets?
We build cockpits that fit the floor, not the org chart. Every module shipped, no phase two. Get in touch.
Start a project